Building wealth through investing isn’t reserved for Wall Street professionals or the ultra-wealthy. Investing for beginners starts with understanding one fundamental truth: money that sits idle loses value to inflation, while money that works for you compounds over time.
The math behind money reveals a simple equation: consistent investing + time + compound growth = wealth accumulation. This isn’t speculation; it’s arithmetic proven across decades of market data.
This comprehensive guide breaks down the investing fundamentals that transform financial uncertainty into data-driven confidence. Whether starting with $100 or $10,000, the principles remain identical. The difference lies in understanding how capital allocation, risk management, and time horizons interact to generate returns.
Readers will learn the evidence-based framework for selecting investments, opening accounts, and building portfolios that align with specific financial goals. Each section connects to deeper resources covering compound interest calculations, portfolio diversification strategies, and tax-advantaged account selection.
The journey from financial beginner to confident investor follows a logical progression. No hype. No shortcuts. Just clear explanations of how wealth building actually works.
Key Takeaways
- Investing differs from saving: Savings preserve capital with minimal returns; investing grows wealth through calculated risk exposure over extended time horizons
- Compound growth drives wealth: Reinvested returns generate exponential growth—a $10,000 investment at 10% annual returns becomes $67,275 in 20 years
- Diversification manages risk: Spreading capital across multiple asset classes (stocks, bonds, ETFs) reduces portfolio volatility without sacrificing long-term returns
- Tax-advantaged accounts accelerate growth: Roth IRAs and 401(k)s provide tax-free or tax-deferred compounding, significantly increasing terminal wealth values
- Consistency outperforms timing: Dollar-cost averaging—investing fixed amounts regularly—eliminates the need to predict market movements and reduces emotional decision-making
What Is Investing and How Does It Work?
Investing means allocating capital to assets with the expectation of generating returns over time. Unlike saving—which preserves purchasing power through low-risk vehicles like savings accounts—investing accepts calculated risk in exchange for growth potential.
The mechanism is straightforward: capital flows into productive assets (stocks, bonds, real estate) that generate income or appreciate. As these assets grow, the investor’s wealth increases proportionally.
Saving vs Investing: The Critical Distinction
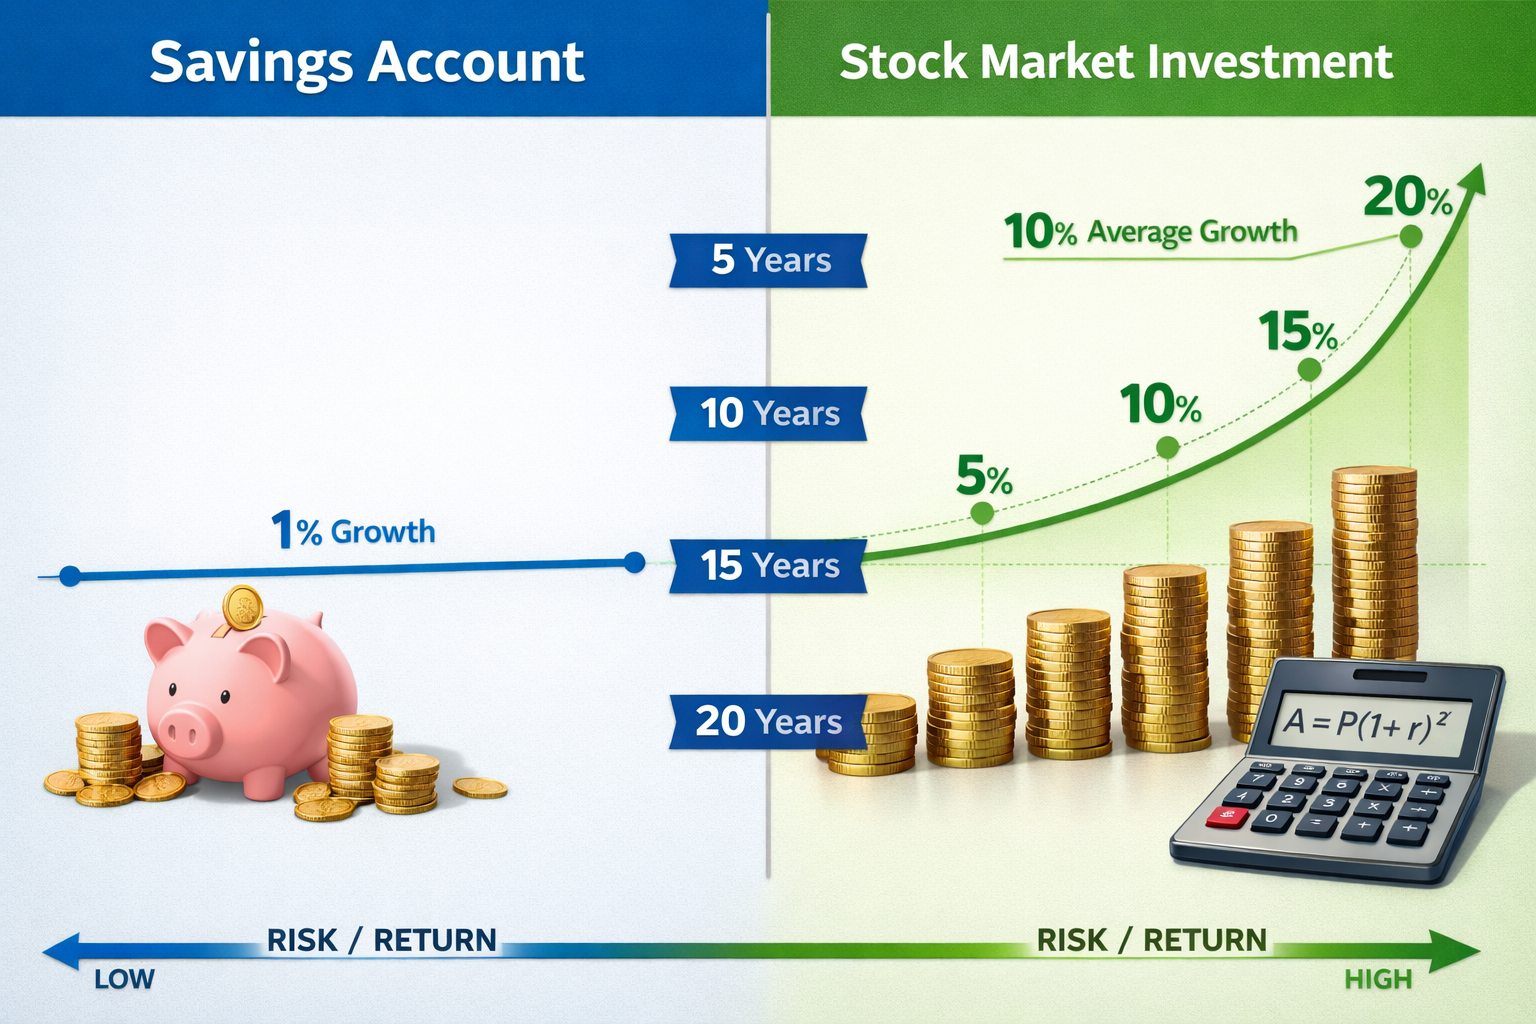
Saving prioritizes capital preservation. Money sits in FDIC-insured accounts earning 0.5-4% annual percentage yield (APY). The primary function: emergency funds, short-term goals, and liquidity maintenance.
Investing prioritizes capital appreciation. Money enters markets with historical returns of 7-10% annually (adjusted for inflation). The primary function: long-term wealth accumulation, retirement funding, and purchasing power growth.
The mathematical difference compounds dramatically. A $10,000 emergency fund in a high-yield savings account at 4% APY grows to $14,802 in 10 years. The same $10,000 invested in an S&P 500 index fund at 10% annual returns becomes $25,937.
Takeaway: Savings protect against immediate needs. Investments build future wealth. Both serve distinct purposes in a complete financial strategy.
See Also: Savings vs Investing to know when to save and when to invest.
Assets vs Liabilities (What Grows Your Net Worth)
Asset
An asset is something you own that adds value to your net worth or puts money in your pocket over time.
Assets can generate income, appreciate, or both.
Examples include investments, cash-flowing real estate, businesses, and productive skills.
Liability
A liability is something you own or owe that costs you money and reduces your net worth.
Liabilities require ongoing payments, expenses, or maintenance without producing income.
Examples include consumer debt, depreciating items bought on credit, and high-interest loans.
Understanding assets vs liabilities is the foundation of investing and wealth building. Assets put money in your pocket and grow your net worth, while liabilities cost you money over time. Knowing the difference helps you make smarter investing decisions and avoid financial traps that keep people stuck.
Risk vs Return: The Fundamental Trade-Off
Every investment carries risk, the probability of losing capital or underperforming expectations. Higher potential returns require accepting higher risk levels.
This relationship isn’t arbitrary. It reflects market efficiency: investors demand compensation (higher returns) for accepting uncertainty (higher risk).
Risk categories:
- Low risk: Government bonds, high-yield savings (1-4% returns)
- Moderate risk: Corporate bonds, dividend stocks, balanced funds (4-7% returns)
- High risk: Growth stocks, sector ETFs, emerging markets (7-15%+ returns with higher volatility)
The key insight: risk tolerance must align with time horizon. A 25-year-old investing for retirement in 40 years can withstand market volatility. A 60-year-old planning to retire in 5 years cannot.
Risk management doesn’t mean avoiding risk—it means calibrating exposure to match goals and timelines.
Time Horizon: The Investor’s Greatest Advantage
Time horizon represents the duration between initial investment and capital withdrawal. This single variable determines appropriate asset allocation more than any other factor.
Short-term horizons (1-3 years): Prioritize capital preservation. Use savings accounts, money market funds, or short-term bonds. Market volatility poses unacceptable risk when liquidity needs are imminent.
Medium-term horizons (3-10 years): Balance growth and stability. Consider 60/40 stock/bond portfolios or target-date funds. Moderate risk exposure allows recovery from temporary downturns.
Long-term horizons (10+ years): Maximize growth potential. Emphasize stock-heavy portfolios (80-100% equities). Time allows compound growth to overcome short-term volatility.
Historical data confirms this logic. The S&P 500 has never produced a negative return over any 20 years since 1926 [1]. Over 1-year periods, returns range from -43% to +54%. Time transforms volatility into predictability.
Insight: The longer the investment timeline, the more aggressively capital can pursue growth. This mathematical reality makes early investing exponentially valuable.
For a deeper exploration of how compound returns accelerate over time, review the compound interest fundamentals that power long-term wealth building.
Types of Investments You Can Choose From
Understanding available investment vehicles allows strategic capital allocation based on specific financial goals, risk tolerance, and time horizons. Each asset class offers distinct characteristics, return profiles, and risk exposures.
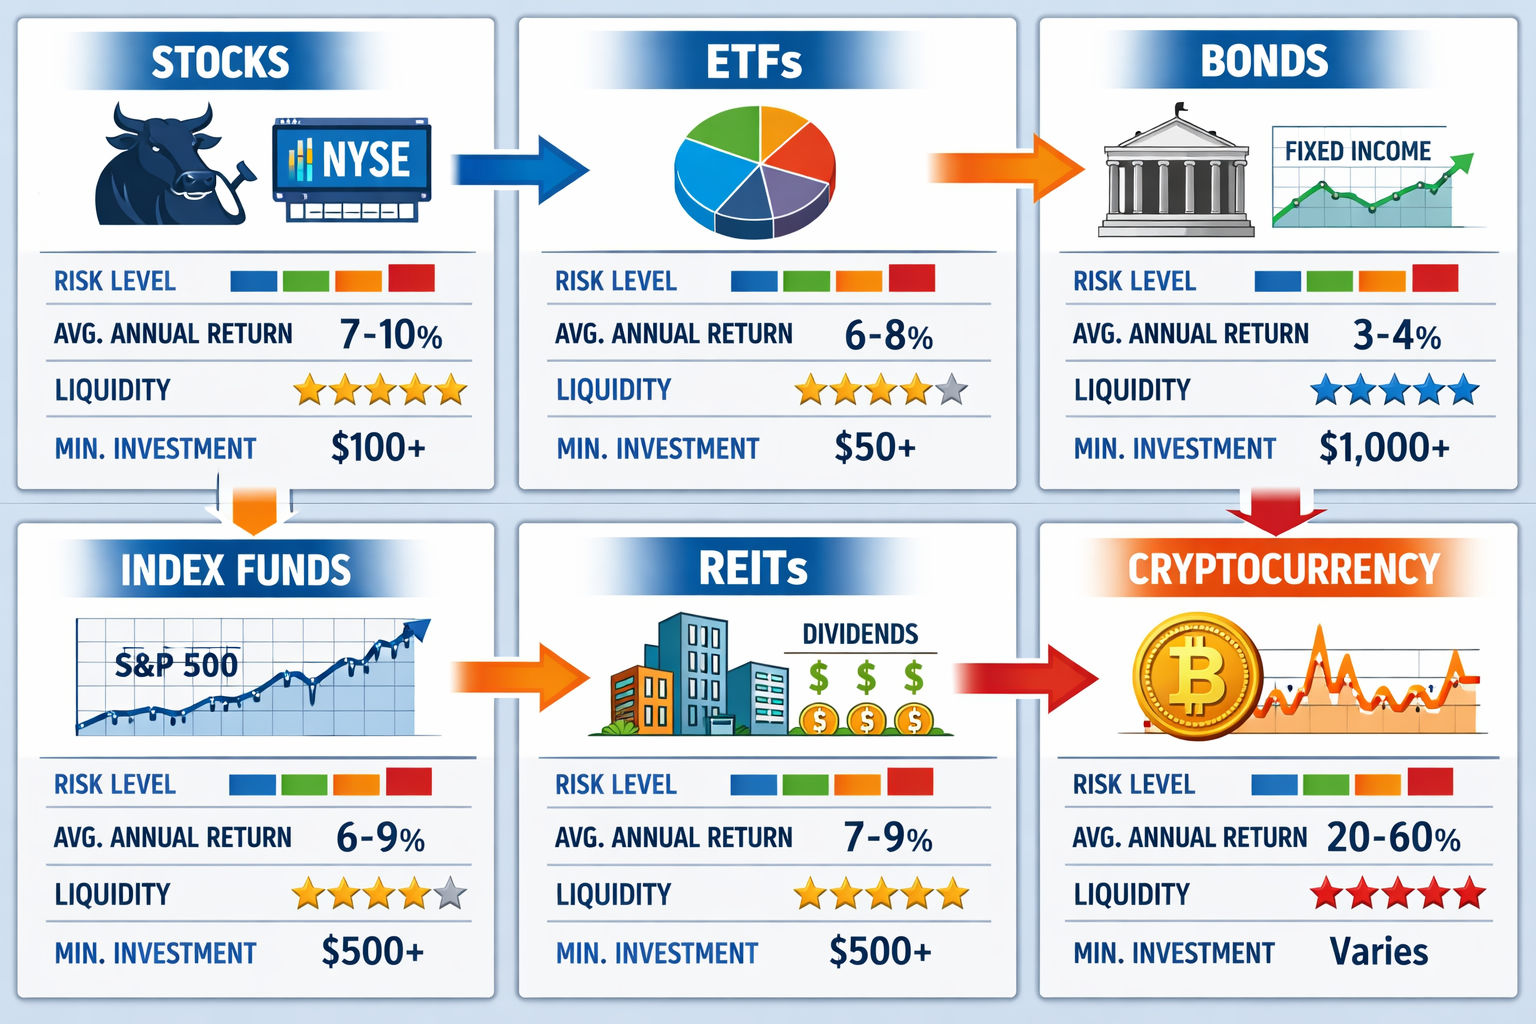
Stocks: Ownership in Public Companies
Stocks (equities) represent fractional ownership in corporations. When purchasing shares, investors acquire proportional claims on company assets and earnings.
Return mechanisms:
- Capital appreciation: Share price increases as the company value grows
- Dividends: Periodic cash distributions from company profits
Risk profile: High volatility, high long-term return potential. Individual stock prices fluctuate based on company performance, sector trends, and market sentiment.
Historical returns: U.S. stocks have delivered approximately 10% annualized returns since 1926 [2]. However, individual stocks can lose 100% of their value if companies fail.
Use case: Long-term growth portfolios (10+ year horizons) where volatility is acceptable. Suitable for investors comfortable with research or willing to accept concentration risk.
Practical consideration: Individual stock selection requires fundamental analysis, evaluating financial statements, competitive positioning, and valuation metrics. Most beginners benefit from diversified funds rather than stock picking.
For investors interested in dividend-focused strategies, explore monthly dividend stocks and ETFs that generate regular cash flow.
ETFs & Index Funds: Diversified Market Exposure
Exchange-Traded Funds (ETFs) and index funds pool investor capital to purchase baskets of securities tracking specific indices, sectors, or strategies.
Key advantages:
- Instant diversification: A Single purchase provides exposure to hundreds or thousands of securities
- Low costs: Expense ratios typically 0.03-0.20% annually
- Tax efficiency: ETF structure minimizes capital gains distributions
- Transparency: Holdings disclosed daily
Index fund methodology: Passive management replicates benchmark performance (S&P 500, total market, international indices) rather than attempting to outperform through active selection.
Performance evidence: Over 15-year periods, 92% of actively managed funds underperform their benchmark indices after fees. This data supports index investing for most investors.
Popular options:
- VOO/SPY: S&P 500 index (500 largest U.S. companies)
- VTI: Total U.S. stock market (3,500+ companies)
- VXUS: Total international stock market
- AGG: U.S. aggregate bond market
Takeaway: ETFs and index funds provide professional-grade diversification at minimal cost, making them ideal core holdings for beginner portfolios.
Bonds: Fixed-Income Securities
Bonds represent loans to governments or corporations. Investors receive periodic interest payments (coupons) and principal repayment at maturity.
Bond characteristics:
- Face value: Principal amount (typically $1,000)
- Coupon rate: Annual interest percentage
- Maturity date: When the principal is repaid
- Credit rating: Default risk assessment (AAA to D)
Return profile: Lower volatility than stocks, lower long-term returns. Investment-grade bonds historically return 4-6% annually.
Risk factors:
- Interest rate risk: Bond prices fall when rates rise
- Credit risk: Issuer may default on payments
- Inflation risk: Fixed payments lose purchasing power
Strategic use: Portfolio stabilization, income generation, capital preservation for near-term goals.
Bond allocation framework: Common guidance suggests age-based allocation (age = bond percentage). A 30-year-old might hold 30% bonds, 70% stocks. This formula provides starting points, not absolute rules.
For understanding how bonds compare to equities in portfolio construction, examine the risk-return trade-offs between asset classes.
Alternative Investments: REITs, Commodities, and Beyond
Alternative investments encompass assets outside traditional stocks and bonds, offering unique risk-return profiles and diversification benefits.
Real Estate Investment Trusts (REITs): Companies owning income-producing real estate. REITs must distribute 90% of taxable income as dividends, providing consistent cash flow.
REIT advantages:
- Real estate exposure without property management
- High dividend yields (3-5% typical)
- Inflation hedge through rent increases
- Portfolio diversification (low correlation to stocks)
Top REIT sectors: Residential, commercial, healthcare, industrial, and data centers.
Investors seeking passive real estate income should review the best REITs to invest in for current opportunities.
Commodities: Physical goods (gold, oil, agricultural products) or commodity futures. Primarily used as inflation hedges and portfolio diversifiers.
Cryptocurrency: Digital assets using blockchain technology. Extremely high volatility, speculative valuations, emerging regulatory environment. Suitable only for risk-tolerant investors allocating <5% of portfolios.
Insight: Alternative investments add diversification but increase complexity. Beginners should master stocks, bonds, and ETFs before exploring alternatives.
How to Choose a Brokerage Account for Investing for Beginners
Brokerage accounts provide the infrastructure for buying and selling investments. Selecting the right platform affects costs, available investments, and user experience.
What Brokerages Do
Brokerages act as intermediaries between investors and securities markets. They execute trades, maintain custody of assets, provide research tools, and handle regulatory compliance.
Account types:
- Individual taxable accounts: Standard investment accounts with no contribution limits
- Retirement accounts: IRAs, Roth IRAs, 401(k)s with tax advantages
- Custodial accounts: UTMA/UGMA for minors
Core functions:
- Trade execution (stocks, ETFs, bonds, options)
- Asset custody and protection (SIPC insurance up to $500,000)
- Research and educational resources
- Tax reporting (1099 forms)
Fee Structures and Cost Considerations
Trading commissions: Most major brokerages now offer $0 commission stock and ETF trades. This eliminates a significant historical barrier for small investors.
Expense ratios: Internal fund costs (0.03-1.0% annually). Lower is better—a 0.5% difference on a $100,000 portfolio costs $500 annually.
Account fees: Monthly maintenance, inactivity, or minimum balance fees. Many brokerages waive these for standard accounts.
Margin interest: Borrowing costs if using leverage. Rates typically 6-12% annually.
Hidden costs: Payment for order flow, bid-ask spreads, and market impact affect execution quality but aren’t directly visible.
Cost comparison example:
- Fidelity: $0 trades, 0.015% expense ratio index funds
- Vanguard: $0 trades, 0.04% expense ratio, index funds
- Schwab: $0 trades, 0.02% expense ratio, index funds
Takeaway: Fee differences appear small but compound significantly. A 0.5% annual fee reduces a $100,000 portfolio by $28,000 over 30 years at 8% returns.
Tools, Research, and Platform Features
Essential platform features:
- Mobile app: Trade execution, account monitoring, research access
- Screeners: Filter investments by criteria (dividend yield, P/E ratio, sector)
- Research reports: Third-party analysis (Morningstar, CFRA)
- Educational content: Tutorials, webinars, market commentary
- Customer service: Phone, chat, email support quality
Advanced features (for experienced investors):
- Options trading
- Margin accounts
- International markets
- Advanced charting
- API access
Beginner-friendly platforms: Prioritize intuitive interfaces, educational resources, and fractional shares (invest with any dollar amount).
Decision framework:
- Determine account type needed (taxable, IRA, Roth IRA)
- Compare fee structures
- Evaluate available investments (mutual funds, ETFs, stocks)
- Test platform usability
- Verify customer service quality
For detailed platform comparisons, review analyses of popular brokerage options to identify the best fit for specific needs.
Brokerage Platform Comparison
Choosing the right brokerage platform is an important part of investing, especially for beginners. Different platforms offer different strengths — from ease of use and low fees to research tools, account types, and long-term investing support.
The comparisons below break down popular brokerage platforms side by side, focusing on factors that actually matter to investors, such as costs, features, investment options, and who each platform is best suited for. These guides are designed to help you understand the trade-offs so you can choose a brokerage that fits your investing style, experience level, and goals.
Robinhood vs Fidelity
A detailed comparison of simplicity versus full-service investing, covering fees, tools, account options, and long-term suitability.
Popular brokerage comparisons, including Robinhood vs Fidelity, help you decide which platform fits your investing style.
Webull vs Robinhood
A side-by-side look at two commission-free trading platforms, focusing on trading tools, usability, and which type of investor each platform serves best.
Vanguard vs Fidelity
A comparison of two long-term investing leaders, highlighting index funds, retirement accounts, research tools, and investor philosophy.
Best Brokerage for Beginners
An overview of beginner-friendly brokerage platforms, including what new investors should prioritize when opening their first investment account.
Types of Investment Accounts: Tax-Advantaged vs Taxable
Account selection significantly impacts long-term wealth accumulation through tax treatment of contributions, growth, and withdrawals. Understanding these structures allows strategic tax optimization.
Roth IRA: Tax-Free Growth and Withdrawals
Roth IRA mechanics: Contributions made with after-tax dollars. Investments grow tax-free. Qualified withdrawals (age 59½+, account open 5+ years) incur zero taxes.
Contribution limits (2026): $7,000 annually ($8,000 if age 50+). Income phase-outs apply: single filers $146,000-$161,000, married filing jointly $230,000-$240,000.
Strategic advantages:
- Tax-free compounding eliminates tax drag
- No required minimum distributions (RMDs)
- Contributions (not earnings) are withdrawable anytime, penalty-free
- Tax diversification in retirement
Mathematical impact: A $7,000 annual contribution for 30 years at 8% returns grows to $850,000 in a Roth IRA—completely tax-free. In a taxable account, the same investment yields approximately $680,000 after capital gains taxes (assuming a 20% rate).
Optimal use: Young investors in lower tax brackets, individuals expecting higher future tax rates, and long-term growth portfolios.
Learn the basics of tax-advantaged investing in our Roth IRA explained guide.
Traditional IRA: Tax-Deferred Growth
Traditional IRA mechanics: Contributions may be tax-deductible (income limits apply). Investments grow tax-deferred. Withdrawals taxed as ordinary income.
Contribution limits: Same as Roth IRA ($7,000/$8,000). Deductibility phases out for higher earners covered by workplace retirement plans.
Tax benefit: Immediate tax deduction reduces current-year taxable income. A $7,000 contribution saves $1,540 in taxes for someone in the 22% bracket.
Required minimum distributions: Withdrawals are mandatory starting at age 73, based on IRS life expectancy tables.
Strategic considerations: Best for individuals in high current tax brackets expecting lower retirement brackets, maximizing immediate tax savings.
Roth vs Traditional decision: Current tax rate vs expected future tax rate determines optimal choice. Higher current rates favor traditional (immediate deduction). Expectations of higher future rates favor Roth (tax-free withdrawals).
Investors choosing tax-advantaged accounts often compare Roth IRA vs Traditional IRA to understand how taxes and withdrawals differ.
401(k): Employer-Sponsored Retirement Plans
401(k) structure: Employer-sponsored defined contribution plans allowing pre-tax (traditional) or after-tax (Roth) contributions.
Contribution limits (2026): $23,500 annually ($31,000 if age 50+). Employer matches don’t count toward employee limits.
Employer match: Free money. A 50% match on 6% of salary equals an instant 50% return. Always contribute enough to capture the full match.
Vesting schedules: Employer contributions may require tenure (2-6 years typical) before full ownership.
Investment options: Limited to plan menu (typically 10-30 funds). Expense ratios are often higher than retail equivalents.
Withdrawal rules: Early withdrawals (before 59½) incur a 10% penalty plus ordinary income taxes. Exceptions exist for hardship, first home purchase, and separation from service after age 55.
Priority framework:
- Contribute to 401(k) up to employer match
- Max out Roth IRA ($7,000)
- Return to 401(k) to reach $23,500 limit
- Consider a taxable brokerage for additional investing
Taxable Brokerage Accounts: Flexibility Without Restrictions
Taxable accounts offer unlimited contributions, no withdrawal penalties, and complete investment flexibility—at the cost of annual tax liability.
Tax treatment:
- Dividends: Qualified dividends taxed at 0-20% (capital gains rates). Non-qualified dividends are taxed as ordinary income.
- Capital gains: Short-term (<1 year holding) taxed as ordinary income. Long-term (>1 year) taxed at 0-20%.
- Interest: Taxed as ordinary income
Strategic advantages:
- No contribution limits
- Access funds anytime without penalties
- Tax-loss harvesting opportunities
- Estate planning benefits (step-up in basis at death)
Optimal use: After maxing tax-advantaged accounts, goals with <10-year horizons, high-income earners exceeding IRA limits.
Tax efficiency strategies:
- Hold tax-inefficient assets (bonds, REITs) in retirement accounts
- Hold tax-efficient assets (index ETFs, growth stocks) in taxable accounts
- Harvest losses to offset gains
- Donate appreciated securities to charity (avoid capital gains, receive a deduction)
Takeaway: Tax-advantaged accounts should be maximized first for retirement savings. Taxable accounts provide flexibility for other goals and additional capital deployment.
Understanding the 4% rule helps determine how much to accumulate across these account types for retirement sustainability.
Popular Investment Strategies for Investing for Beginners
Investment strategies provide systematic frameworks for capital allocation, risk management, and return optimization. Evidence-based approaches eliminate emotional decision-making and improve long-term outcomes.
Buy and Hold Investing: Time-Tested Wealth Building
Buy and hold means purchasing quality investments and maintaining positions through market cycles, allowing compound growth to accumulate over decades.
Core principle: Market timing is unreliable. Time in the market beats timing the market.
Supporting evidence: Missing the 10 best days in the S&P 500 from 2000-2020 reduced returns from 6.1% to 2.5% annually. Since best days often follow worst days, frequent trading increases the risk of missing recoveries.
Implementation:
- Select diversified, low-cost index funds or quality individual stocks
- Invest available capital
- Ignore short-term volatility
- Rebalance annually to maintain target allocation
- Hold for 10+ years minimum
Psychological requirement: Tolerance for temporary losses. The S&P 500 experiences 10%+ corrections every 1-2 years on average. Buy-and-hold investors view these as irrelevant noise.
Tax efficiency: Minimizes capital gains taxes through reduced turnover. Long-term capital gains rates (0-20%) significantly beat short-term rates (ordinary income).
Optimal for: Long-term retirement accounts, investors lacking time for active management, and those seeking to minimize costs and taxes.
Learn how investing creates real wealth through ownership, compounding, and long-term thinking.
Dollar-Cost Averaging: Systematic Risk Reduction
Dollar-cost averaging (DCA) invests fixed dollar amounts at regular intervals regardless of price, automatically buying more shares when prices are low and fewer when prices are high.
Mechanism: $500 monthly investment purchases 5 shares at $100, but 10 shares at $50. This averages down the cost basis over time.
Advantages:
- Eliminates timing decisions
- Reduces the impact of volatility
- Enforces investment discipline
- Psychologically easier than lump-sum investing
Mathematical comparison: DCA underperforms lump-sum investing approximately 66% of the time in rising markets. However, DCA reduces regret risk and enables investing when lump sums aren’t available.
Practical application: Most effective for regular income (salary) investing. Automate transfers from checking to brokerage accounts monthly.
Example calculation: $500 monthly for 30 years at 8% returns = $745,000. Same total invested as a lump sum ($180,000) but accumulated gradually.
Strategic use: Primary method for retirement account contributions (401(k), IRA), investors with regular income, risk-averse individuals uncomfortable with lump-sum market exposure.
Compare strategies like Dollar-Cost-Averaging vs Lump-Sum Investing to decide how and when to invest your money.
For those building systematic investment habits, understanding budgeting frameworks helps allocate income toward consistent investing.
Dividend Investing: Cash Flow Generation
Dividend investing prioritizes stocks or funds paying regular cash distributions, generating passive income streams while maintaining growth potential.
Dividend metrics:
- Dividend yield: Annual dividend ÷ share price (3-5% typical for dividend stocks)
- Payout ratio: Dividends ÷ earnings (sustainable below 60%)
- Dividend growth rate: Annual increase percentage
Advantages:
- Regular cash flow (quarterly, typically)
- Lower volatility than growth stocks
- Inflation protection through dividend growth
- Compounding through reinvestment
Dividend aristocrats: S&P 500 companies increasing dividends for 25+ consecutive years. Historical outperformance with lower volatility than the broader market.
Tax considerations: Qualified dividends taxed at favorable capital gains rates (0-20%). REITs and non-qualified dividends are taxed as ordinary income.
Implementation approaches:
- Individual stocks: Research dividend aristocrats, assess payout sustainability
- Dividend ETFs: Instant diversification (best dividend ETFs)
- Reinvestment: Automatic DRIP (dividend reinvestment plans) compound returns
Caution: High yields (>6%) may signal financial distress or unsustainable payouts. Prioritize dividend growth over current yield.
Optimal for: Retirees seeking income, investors wanting tangible returns, portfolios emphasizing stability over maximum growth.
For a deeper understanding, dive into our full guide on Dividend investing
Growth vs Value Investing: Complementary Approaches
Growth investing targets companies with above-average earnings growth potential, accepting higher valuations for future expansion.
Growth characteristics:
- High P/E ratios (25-50+)
- Minimal or no dividends (reinvesting in expansion)
- Revenue growth >15% annually
- Technology, healthcare, and consumer discretionary sectors
Historical returns: Growth stocks outperform in bull markets but experience sharper corrections in downturns.
Value investing seeks undervalued companies trading below intrinsic worth based on fundamental analysis.
Value characteristics:
- Low P/E ratios (<15)
- Higher dividend yields
- Established businesses with stable cash flows
- Financial, energy, and industrial sectors
Valuation metrics: Price-to-book, price-to-earnings, and price-to-cash-flow ratios identify potential value opportunities.
Performance cycles: Value and growth alternate leadership. Value outperformed 2000-2007, growth dominated 2010-2021, value resurged 2022-2023.
Balanced approach: Combining both styles provides diversification across market conditions. Total market index funds naturally include both.
Insight: Neither strategy consistently outperforms long term. Diversification across growth and value reduces timing risk and captures returns from both segments.
Investment Risks and Common Mistakes to Avoid
Risk management separates successful long-term investors from those who abandon strategies during inevitable downturns. Understanding behavioral pitfalls and market realities prevents costly errors.
Emotional Investing: The Wealth Destroyer
Emotional investing occurs when fear or greed overrides rational decision-making, leading to buying high (euphoria) and selling low (panic).
The cycle of market emotions: Optimism → excitement → thrill → euphoria (market peak) → anxiety → denial → fear → desperation → panic → capitulation (market bottom) → depression → hope → relief → optimism.
Most investors buy during euphoria and sell during panic—the exact opposite of profitable behavior.
Data evidence: The average equity fund investor underperformed the S&P 500 by 4.0% annually over the 20 years ending 2023. This gap results primarily from poor timing decisions driven by emotion.
Behavioral biases:
- Recency bias: Overweighting recent events (assuming bull markets continue indefinitely)
- Loss aversion: Feeling losses 2x more intensely than equivalent gains
- Confirmation bias: Seeking information supporting existing beliefs
- Herd mentality: Following crowd behavior at market extremes
Mitigation strategies:
- Establish an investment policy statement defining strategy and allocation
- Automate contributions and rebalancing
- Avoid checking portfolios daily (quarterly is sufficient)
- Maintain an emergency fund to prevent forced liquidations
- Focus on the time horizon, not temporary volatility
Takeaway: Emotional discipline provides a greater return impact than security selection. The best investment strategy is the one that investors can maintain through complete market cycles.
Overtrading: Death by a Thousand Cuts
Overtrading means excessive buying and selling driven by short-term price movements, market news, or misguided attempts at timing.
Cost impacts:
- Transaction costs: Even $0 commissions incur bid-ask spreads
- Tax inefficiency: Short-term capital gains taxed at ordinary income rates (up to 37% federal)
- Opportunity cost: Missing subsequent rallies after selling
Performance evidence: Accounts with the highest turnover underperform low-turnover accounts by 6-7% annually. Trading costs and poor timing compound dramatically.
Common triggers:
- Daily market news and commentary
- Short-term price volatility
- Tips from friends, social media, or financial media
- Attempting to “lock in gains” or “cut losses.”
Optimal turnover: Index fund portfolios with <10% annual turnover consistently outperform active strategies with 50-100%+ turnover.
Solution: Implement a buy-and-hold strategy with a predetermined rebalancing schedule (annually or when allocations drift >5% from targets).
Lack of Diversification: Concentration Risk
Diversification spreads capital across multiple investments, reducing the impact of any single position’s poor performance.
The mathematics: A portfolio of 30 uncorrelated stocks reduces volatility by approximately 70% compared to single-stock risk [8]. Returns remain similar, but path smoothness improves dramatically.
Diversification dimensions:
- Asset classes: Stocks, bonds, real estate, commodities
- Geographic regions: U.S., international developed, and emerging markets
- Sectors: Technology, healthcare, financials, consumer goods
- Company size: Large-cap, mid-cap, small-cap
- Investment styles: Growth, value, dividend
Common mistakes:
- Holding only employer stock (concentration + employment risk correlation)
- Investing exclusively in the home country (missing 50%+ of global opportunities)
- Owning 20 technology stocks (sector concentration, not diversification)
Efficient diversification: Total market index funds provide instant exposure to thousands of securities across sectors and sizes.
Correlation consideration: True diversification requires low correlation between holdings. Ten S&P 500 stocks don’t diversify—they move together. Stocks + bonds + REITs provide genuine diversification.
Rebalancing requirement: Diversification degrades over time as winners grow and losers shrink. Annual rebalancing maintains target allocations and forces “buy low, sell high” discipline.
Insight: Diversification is the only free lunch in investing—reducing risk without sacrificing returns. Concentration may generate higher returns in specific scenarios, but it dramatically increases ruin probability.
Understanding asset allocation principles helps construct properly diversified portfolios aligned with risk tolerance and goals.
How to Start Investing: A Beginner Roadmap
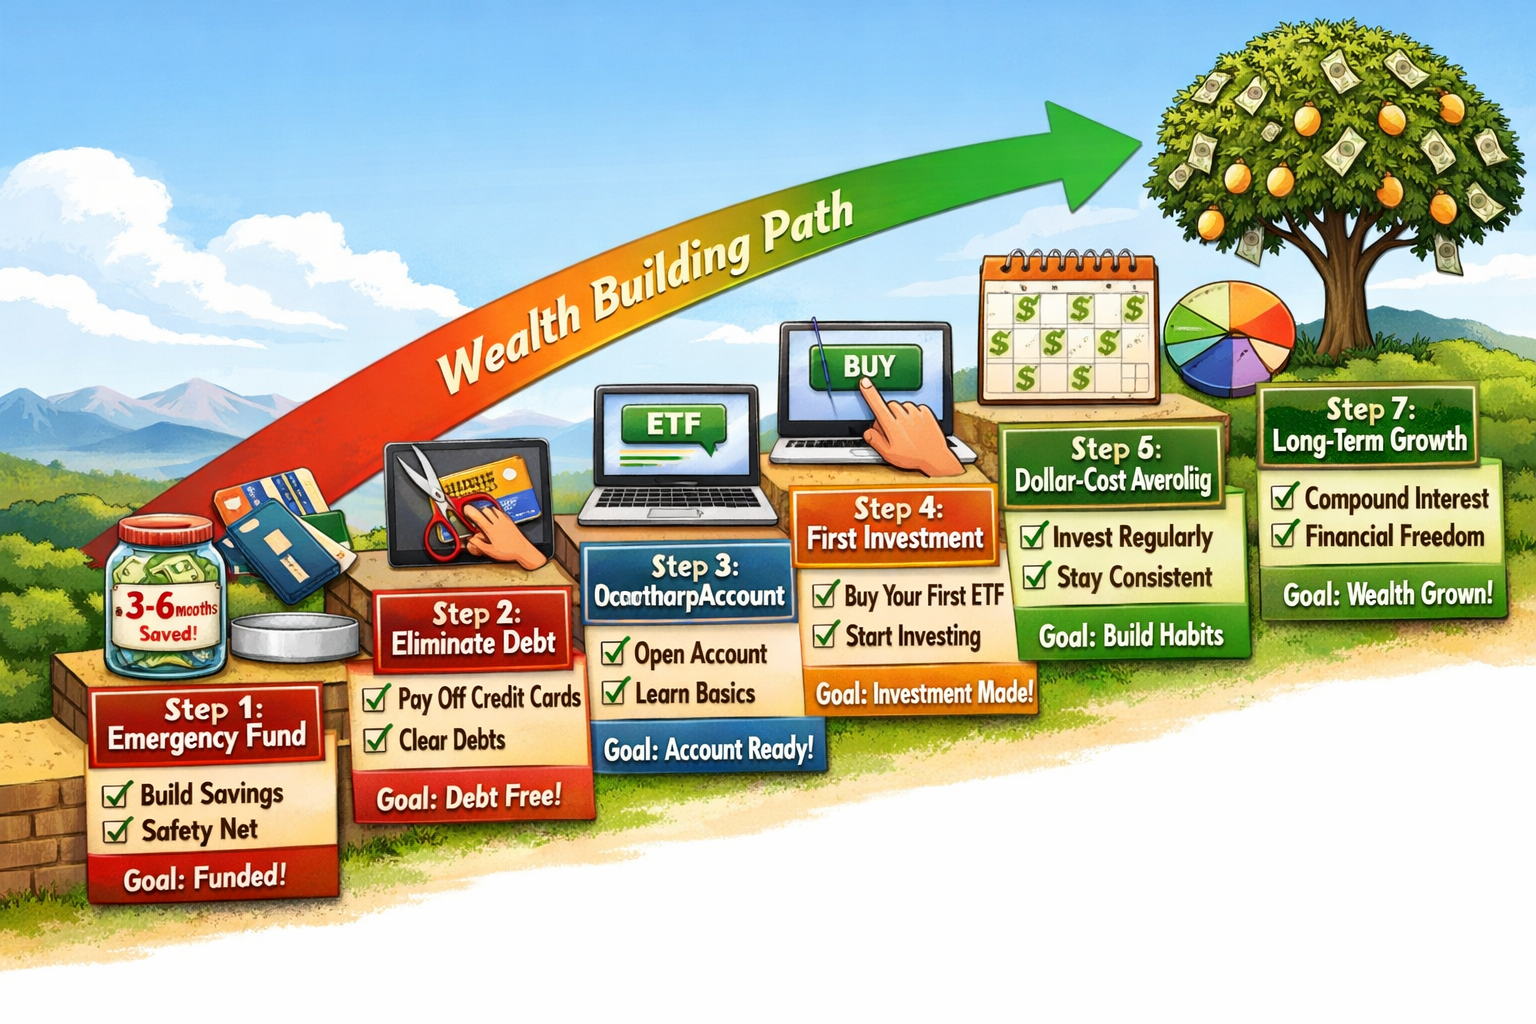
Systematic implementation transforms investing knowledge into wealth-building action. This roadmap provides the exact sequence for establishing a sustainable investment practice.
Step 1: Build Emergency Fund Foundation
Emergency funds provide liquidity for unexpected expenses (job loss, medical bills, home repairs) without forcing investment liquidations at unfavorable times.
Target amount: 3-6 months of essential expenses. Higher for variable income, single-income households, or unstable employment.
Calculation example: $3,000 monthly expenses × 6 months = $18,000 emergency fund target.
Optimal location: High-yield savings accounts offering 4-5% APY with FDIC insurance and immediate access.
Rationale: Prevents forced selling during market downturns. A fully-funded emergency reserve allows aggressive investing with confidence.
Timeline: Prioritize emergency fund completion before significant investing. The psychological security enables better investment decisions.
Before investing, start with Emergency Fund Basics to cover unexpected expenses.
Step 2: Eliminate High-Interest Debt
High-interest debt (credit cards, payday loans) typically carries 15-25%+ interest rates—higher than expected investment returns.
Mathematical logic: Paying off 20% APR debt provides a guaranteed 20% “return” (interest saved). No investment reliably beats this risk-free return.
Debt prioritization:
- Credit cards (15-25% APR)
- Personal loans (8-15% APR)
- Auto loans (4-8% APR)
- Student loans (3-7% APR)
- Mortgage (3-5% APR)
Strategic approach: Eliminate debts above 7-8% before investing. Rates below expected investment returns (7-10%) allow simultaneous debt paydown and investing.
Exception: Capture full employer 401(k) match even while carrying debt—the instant 50-100% return exceeds any debt interest rate.
For comprehensive debt management strategies, explore credit utilization optimization and debt reduction frameworks.
Step 3: Open Investment Accounts
Account selection depends on employment status, income level, and investment goals.
Priority sequence:
Employed with 401(k) access:
- 401(k) to employer match maximum
- Roth IRA to $7,000 limit
- 401(k) to $23,500 limit
- Taxable brokerage for additional capital
Self-employed or no 401(k):
- Roth IRA or Traditional IRA to $7,000 limit
- Solo 401(k) or SEP IRA (higher limits for self-employed)
- Taxable brokerage for additional capital
Opening process:
- Select brokerage (Fidelity, Vanguard, Schwab)
- Complete online application (10-15 minutes)
- Provide SSN, employment info, and banking details
- Fund account via bank transfer
- Begin investing
Document requirements: Government ID, Social Security number, bank account information, and employment details.
Timeline: Account approval typically occurs within 1-2 business days. Funding transfers are complete in 3-5 business days.
Step 4: Choose Initial Investments
Beginner-friendly approach: Start with diversified index funds or target-date funds requiring minimal research and maintenance.
Recommended starter portfolio:
Option 1 – Three-Fund Portfolio:
- 60% Total U.S. Stock Market Index (VTI, FSKAX)
- 30% Total International Stock Index (VXUS, FTIHX)
- 10% Total Bond Market Index (BND, FXNAX)
Option 2 – Single Target-Date Fund:
- Select fund matching approximate retirement year (2055, 2060, 2065)
- Automatic diversification and rebalancing
- Gradually shifts conservative side as the target date approaches
Option 3 – Robo-Advisor:
- Algorithm-driven portfolio construction
- Automatic rebalancing and tax-loss harvesting
- Slightly higher fees (0.25-0.50%) but completely hands-off
Initial investment: Most brokerages allow fractional shares—invest any amount, even $10. No need to wait for $1,000 minimums.
Research resources: Fund expense ratios, historical performance, holdings composition available on brokerage platforms, and Morningstar.com.
Insight: Perfect investment selection matters less than starting. A simple total market index fund outperforms 90% of complex strategies over 20+ years.
Step 5: Implement Dollar-Cost Averaging
Automation removes decision-making friction and enforces consistency regardless of market conditions.
Setup process:
- Determine an affordable monthly investment amount
- Schedule automatic transfer from checking to brokerage
- Enable automatic investment into selected funds
- Set the transfer date after the paycheck deposits
Contribution scaling: Start with a comfortable amount ($50, $100, $500 monthly). Increase 1% annually or with raises.
Behavioral advantage: Automatic investing prevents procrastination, eliminates timing decisions, and builds wealth invisibly.
Example progression:
- Year 1: $200/month = $2,400 annual
- Year 2: $220/month = $2,640 annual (+10% increase)
- Year 3: $242/month = $2,904 annual (+10% increase)
Over 30 years at 8% returns with 10% annual contribution increases: $1,180,000 accumulated.
Understanding how Dollar-Cost Averaging works helps manage your portfolio during the market cycle.
Step 6: Maintain Long-Term Consistency
Consistency compounds more powerfully than any other variable. Regular contributions over decades build substantial wealth regardless of market timing.
Discipline requirements:
- Continue contributions during market downturns (buying at discounts)
- Resist urges to sell during corrections
- Ignore financial media noise and short-term volatility
- Review portfolio quarterly, not daily
- Rebalance annually to maintain target allocation
Performance expectations: Expect 7-10% annualized returns long-term, with significant year-to-year variation (-30% to +40% possible in individual years).
Milestone tracking: Focus on contribution consistency and net worth growth, not daily portfolio values.
Course corrections: Increase contributions with income growth, adjust allocation as retirement approaches, but maintain core strategy.
Takeaway: The investor who starts early, contributes consistently, and stays invested through complete market cycles accumulates more wealth than those who time, trade, or hesitate.
Investment Tools and Resources
Practical tools transform theoretical knowledge into actionable financial planning, providing quantitative frameworks for decision-making.
Compound Interest Calculators
Compound interest calculators project investment growth over time, demonstrating the exponential power of reinvested returns.
Key inputs:
- Initial investment amount
- Monthly contribution
- Annual return rate
- Time horizon
- Compounding frequency
Use cases:
- Retirement planning projections
- Goal-based savings targets
- Comparing investment scenarios
- Understanding the time value of money
Example calculation: $10,000 initial + $500 monthly at 8% annual return for 30 years = $745,000 total value ($190,000 contributed, $555,000 from compound growth).
Access detailed compound interest calculators to model specific scenarios and visualize growth trajectories.
Portfolio Allocation Tools
Asset allocation tools help determine optimal stock/bond/alternative ratios based on age, risk tolerance, and time horizon.
Common frameworks:
- Age-based: 110 minus age = stock percentage (30-year-old = 80% stocks)
- Risk tolerance questionnaires: Assess comfort with volatility
- Goal-based: Align allocation with specific timelines
Rebalancing calculators: Determine when allocations drift beyond acceptable ranges and calculate required trades to restore targets.
Retirement Planning Calculators
Retirement calculators estimate required savings rates and portfolio values to sustain a desired retirement lifestyle.
Critical variables:
- Current age and retirement age
- Current savings and contribution rate
- Expected return and inflation rates
- Desired retirement income
- Life expectancy assumptions
The 4% rule: Withdraw 4% of portfolio value in year one, adjust for inflation annually. Historically sustains portfolios for 30+ years.
Example: $1,000,000 portfolio supports $40,000 annual withdrawals (inflation-adjusted) with high success probability.
Understanding the 4% rule mechanics helps determine retirement savings targets and sustainable withdrawal strategies.
Investment Research Platforms
Research tools provide fundamental data, analyst ratings, and comparative metrics for investment evaluation.
Recommended resources:
- Morningstar: Fund ratings, holdings analysis, expense ratio comparisons
- SEC EDGAR: Company filings (10-K, 10-Q) for fundamental research
- FINRA BrokerCheck: Verify advisor credentials and disciplinary history
- Portfolio Visualizer: Backtest strategies and analyze historical performance
Educational platforms:
- Investopedia: Comprehensive financial education and definitions
- Bogleheads Forum: Evidence-based investing community
- CFA Institute: Professional investment research and standards
Insight: Quality research tools enable informed decisions but don’t guarantee superior returns. Simple, low-cost index strategies often outperform complex research-intensive approaches.
💰 Investment Growth Calculator
See how compound interest builds wealth over time
Conclusion
Investing for beginners requires no special expertise, large capital, or market timing ability. The math behind money reveals a simple truth: consistent contributions to diversified, low-cost investments over extended periods build substantial wealth through compound growth.
The evidence-based framework presented here eliminates complexity:
Foundation: Establish an emergency fund, eliminate high-interest debt, and open tax-advantaged accounts.
Implementation: Invest in total market index funds, automate monthly contributions, and maintain buy-and-hold discipline.
Risk management: Diversify across asset classes, align allocation with time horizon, ignore short-term volatility.
Consistency: Continue contributions through market cycles, rebalance annually, focus on decades, not days.
The difference between financial security and struggle often reduces to this single decision: start investing early and never stop. A 25-year-old investing $400 monthly at 8% returns accumulates $1,400,000 by age 65. Waiting until 35 to start yields $610,000—less than half.
Time cannot be recovered. Capital can always be earned. The optimal moment to begin investing was yesterday. The second-best moment is today.
Next steps:
- Calculate an affordable monthly investment amount using budgeting frameworks
- Open a Roth IRA or 401(k) account this week
- Select a total market index fund or a target-date fund
- Automate the first contribution
- Commit to a 10+ year horizon
The journey from financial beginner to confident investor starts with a single decision: choosing to make money work as hard as the effort required to earn it. The mathematics guarantees results. The only variable is action.
Disclaimer
This article provides educational information about investing fundamentals and wealth-building strategies. It does not constitute personalized financial, investment, tax, or legal advice.
Investment performance is not guaranteed. All investments carry risk, including potential loss of principal. Historical returns do not predict future results. Market conditions, economic factors, and individual circumstances significantly affect outcomes.
Readers should conduct independent research and consult qualified financial advisors, tax professionals, and legal counsel before making investment decisions. Individual financial situations, risk tolerance, time horizons, and goals vary substantially.
The Rich Guy Math and its contributors assume no liability for financial decisions made based on this content. Investment decisions remain the sole responsibility of individual investors.
Tax laws, contribution limits, and regulatory requirements change frequently. Verify current rules with official sources (IRS.gov, SEC.gov) or qualified professionals before acting.
SIPC insurance protects against brokerage failure, not investment losses. Past performance statistics represent historical data and do not guarantee future returns.
About the Author
Max Fonji is a data-driven financial educator and the voice behind The Rich Guy Math. With expertise in valuation principles, portfolio analysis, and evidence-based investing strategies, Max translates complex financial concepts into clear, actionable frameworks.
His analytical approach combines rigorous mathematical modeling with practical implementation guidance, helping readers understand the cause-and-effect relationships that drive wealth accumulation. Max’s work emphasizes financial literacy through numbers, logic, and empirical evidence rather than speculation or hype.
Through The Rich Guy Math, Max provides comprehensive resources on investing fundamentals, personal finance optimization, and financial calculators that empower informed decision-making.
Connect with Max and explore additional resources at The Rich Guy Math.
References
[1] Schwab Center for Financial Research. “Historical S&P 500 Returns by Holding Period.” 2024.
[2] Ibbotson Associates. “Stocks, Bonds, Bills, and Inflation (SBBI) Yearbook.” Morningstar, 2024.
[3] S&P Dow Jones Indices. “SPIVA U.S. Scorecard.” 2023.
[4] J.P. Morgan Asset Management. “Market Insights: The Cost of Missing the Best Days.” 2021.
[5] Vanguard Research. “Dollar-cost averaging just means taking risk later.” 2012.
[6] DALBAR, Inc. “Quantitative Analysis of Investor Behavior (QAIB).” 2023.
[7] Barber, Brad M., and Terrance Odean. “Trading Is Hazardous to Your Wealth.” Journal of Finance, 2000.
[8] Statman, Meir. “How Many Stocks Make a Diversified Portfolio?” Journal of Financial and Quantitative Analysis, 1987.
[9] Bengen, William P. “Determining Withdrawal Rates Using Historical Data.” Journal of Financial Planning, 1994.
[10] Dimensional Fund Advisors. “S&P 500 Index Rolling Period Returns.” 2024.
[11] Berkshire Hathaway. “Chairman’s Letter to Shareholders.” 2018.
Frequently Asked Questions About Investing for Beginners
How much money do I need to start investing?
The traditional minimum to start investing is effectively $0. Most modern brokerages offer fractional shares, allowing you to invest with any dollar amount.
A practical recommendation is to start with whatever amount does not compromise your emergency fund or delay paying off high-interest debt. Even investing $25–$50 per month builds wealth through consistency and compound growth.
Mathematically, $50 invested monthly for 40 years at an 8% return grows to approximately $174,000. The starting amount matters far less than starting early and investing consistently.
A smart strategy is to begin investing as soon as you have a 3–6 month emergency fund and high-interest debt under control.
Is investing risky for beginners?
All investing carries risk, defined as the possibility of losing money or underperforming expectations. However, risk varies significantly based on asset selection and time horizon.
Historically, diversified index funds held for 10 or more years have never produced negative inflation-adjusted returns. Short-term investing (1–3 years) carries much higher risk due to market volatility.
- Invest money you won’t need for at least 5 years
- Diversify using broad market index funds
- Avoid concentration in individual stocks
- Maintain an emergency fund to prevent forced selling
- Ignore short-term market fluctuations
The greatest long-term risk is not investing at all. Inflation erodes cash purchasing power over time, reducing real wealth even when balances remain unchanged.
What’s the difference between stocks and ETFs?
Stocks represent ownership in a single company. Buying an individual stock exposes you entirely to that company’s performance.
ETFs (Exchange-Traded Funds) bundle hundreds or thousands of stocks into a single investment. For example, an S&P 500 ETF provides exposure to the largest U.S. companies simultaneously.
For beginners, ETFs offer instant diversification, lower risk, and minimal research requirements, making them an ideal foundational investment.
How long should I invest for?
The minimum recommended investment horizon for stock-based portfolios is 5 years. Shorter timeframes significantly increase the risk of selling during market downturns.
A 10-year or longer horizon dramatically improves outcomes by allowing compound growth to overcome volatility. Historically, long-term investors have been rewarded for patience.
Longer timelines support more aggressive growth strategies, while shorter timelines require capital preservation approaches.
Should I invest during market downturns?
Yes. Market downturns historically provide the best long-term buying opportunities by allowing investors to purchase assets at discounted prices.
Investors who continued investing during major downturns, such as the 2008 financial crisis, achieved strong returns as markets recovered.
Dollar-cost averaging automatically takes advantage of volatility by purchasing more shares when prices are lower. The biggest mistake investors make is stopping contributions during downturns.
Staying invested through full market cycles is essential, as missing the best recovery days can significantly reduce long-term returns.
What’s the best investment strategy for beginners?
The most effective beginner strategy is a low-cost, diversified index fund portfolio using dollar-cost averaging and long-term buy-and-hold discipline.
- Open a Roth IRA or employer retirement account
- Invest in a total market or target-date index fund
- Automate monthly contributions
- Rebalance annually
- Maintain the strategy for 10+ years
This approach minimizes fees, eliminates emotional decision-making, and has historically outperformed the majority of actively managed strategies.