Retirement planning is the process of determining how much money you’ll need when you stop working and creating a strategy to accumulate that amount through systematic saving and investing. The math behind money reveals a simple truth: the earlier you start, the less you need to contribute each month because compound growth does the heavy lifting.
Most people underestimate how much they’ll need or overestimate what Social Security will provide. The average Social Security benefit in 2025 replaces only about 40% of pre-retirement income, yet most retirees need 70-80% to maintain their lifestyle. This gap represents the retirement planning challenge that data-driven strategies solve.
The difference between retiring confidently and running out of money comes down to three variables: time horizon, contribution rate, and investment returns. Understanding how these factors interact creates the foundation for wealth building that lasts decades beyond your final paycheck.
Key Takeaways
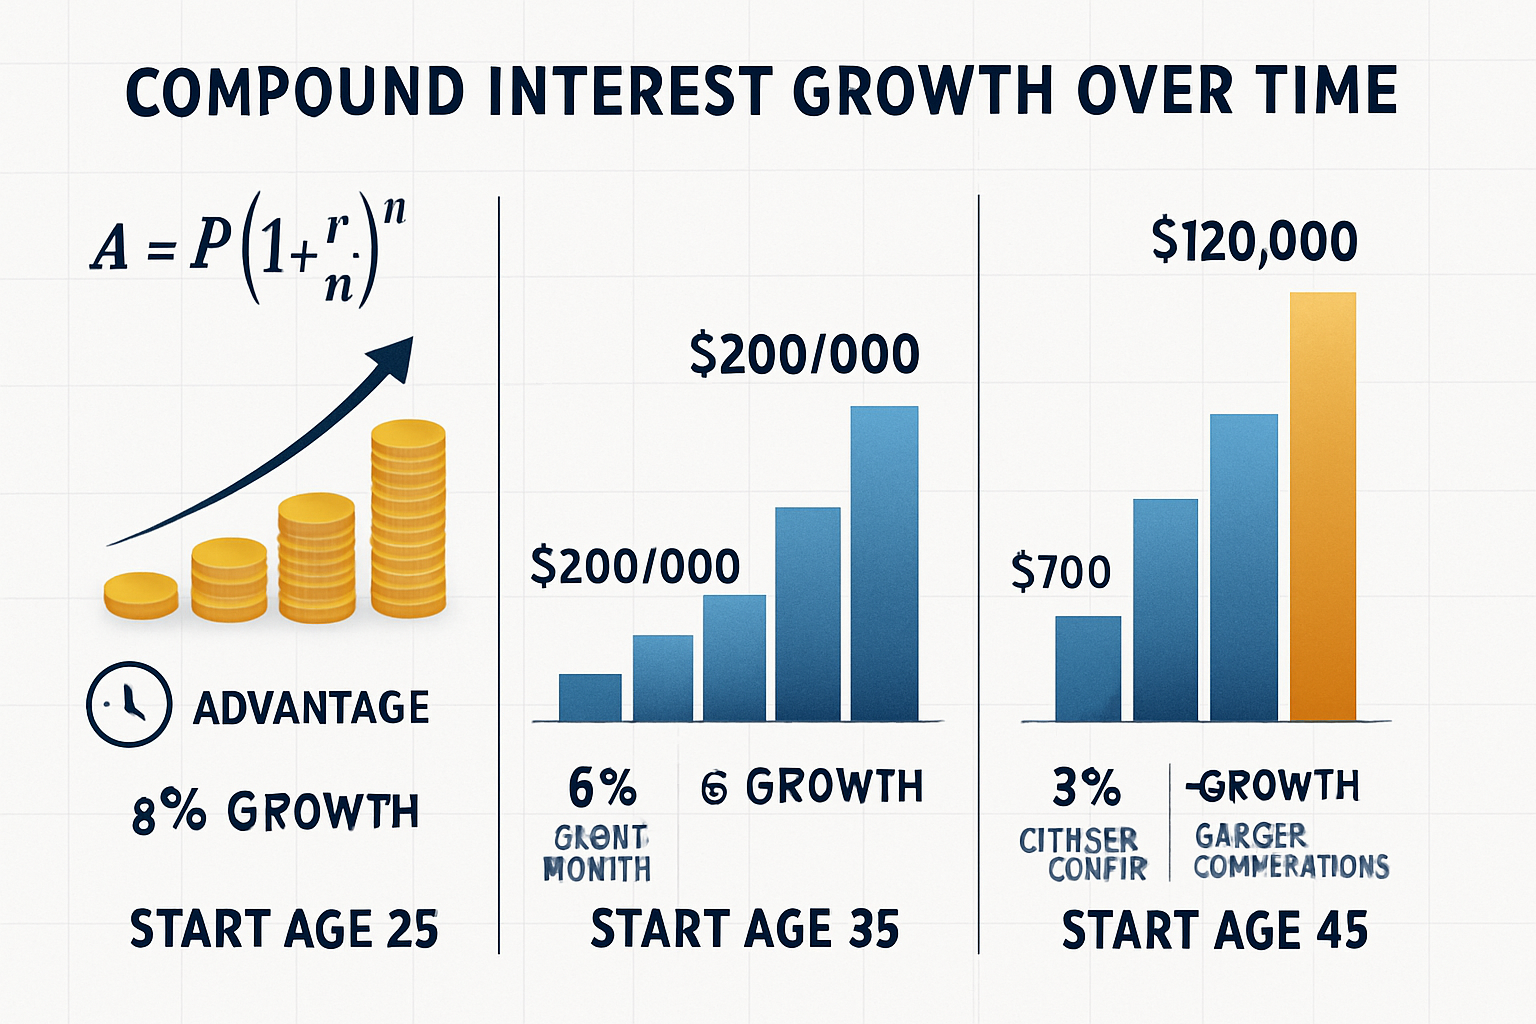
Start early to leverage compound growth – A 25-year-old saving $500/month at 7% returns accumulates $1.14 million by 65; starting at 35 yields only $566,000 with the same contributions.
Social Security alone won’t suffice – Average benefits replace only 40% of pre-retirement income, creating a significant income gap that personal savings must fill.
Tax-advantaged accounts multiply your money – 401(k)s, and IRAs provide immediate tax benefits or tax-free growth, accelerating wealth accumulation compared to taxable accounts.
Withdrawal strategy matters as much as accumulation – Sequence of returns risk and tax-efficient withdrawal order can extend portfolio longevity by 5-10 years.
Benchmarks guide, but personalization wins – While age-based savings multiples provide direction, your actual needs depend on lifestyle, location, and health factors.
What Is Retirement Planning?
Retirement planning means preparing financially for the years when employment income stops and you rely on accumulated savings, investments, and benefits to fund your lifestyle.
At its core, this process answers three fundamental questions:
- How much money will you need? (Income replacement calculation)
- Where will that money come from? (Income sources: savings, Social Security, pensions)
- How do you get from here to there? (Contribution strategy and asset allocation)
The mathematical reality is straightforward: Future Value = Present Contributions × Compound Growth Rate × Time. Each variable you control—how much you save, how you invest it, and when you start—directly impacts the outcome.
Why Social Security Alone Isn’t Enough
Social Security was designed as a safety net, not a complete retirement solution. The average monthly benefit in 2025 is approximately $1,907, or $22,884 annually[2]. For someone who earned $60,000 before retirement, this represents only 38% income replacement.
The replacement ratio decreases as pre-retirement income increases. Higher earners receive proportionally less because Social Security benefits are capped at a maximum amount ($3,822/month in 2025 for those retiring at full retirement age)[3].
Therefore, personal retirement savings must bridge the gap between Social Security benefits and actual living expenses. This gap typically ranges from 30-50% of pre-retirement income, requiring substantial accumulated assets.
The Time and Compounding Advantage
Compound growth transforms modest contributions into significant wealth over decades. The formula demonstrates why starting early matters more than contributing large amounts later:
A = P(1 + r)^t
Where:
- A = Final amount
- P = Principal (initial investment)
- r = Annual return rate
- t = Time in years
A $10,000 investment at age 25 growing at 7% annually becomes $149,745 by age 65. The same $10,000 invested at age 45 grows to only $38,697, a difference of $111,048 from 20 additional years of compounding.
This mathematical relationship explains why retirement planning should begin with your first paycheck, not when retirement seems imminent.
🔗 Related: Personal Finance Fundamentals provides the foundation for all wealth-building strategies, including retirement preparation.
Why Retirement Planning Matters
The cost of delay in retirement planning compounds exponentially. Each year you postpone saving requires either higher monthly contributions or acceptance of a lower retirement standard of living.
The Compounding Math That Changes Everything
Consider three individuals who want $1 million by age 65, assuming 7% annual returns:
Starting at age 25: Monthly contribution needed = $381
Starting at age 35: Monthly contribution needed = $820
Starting at age 45: Monthly contribution needed = $1,900
The 35-year-old must save 2.15 times more per month than the 25-year-old. The 45-year-old must save nearly 5 times more. This isn’t linear—it’s exponential, because lost time eliminates compound growth on contributions that were never made.
Takeaway: Delaying retirement savings by 10 years doesn’t require 10% more savings—it requires 115% more in monthly contributions to reach the same goal.
Inflation Risk Erodes Purchasing Power
Inflation averages 3.1% annually over the long term[4]. At this rate, purchasing power halves every 23 years. A retirement that lasts 30 years experiences significant erosion of fixed-income sources.
Example: $50,000 in today’s dollars requires $82,000 in 15 years to maintain equivalent purchasing power at 3.1% inflation. By year 30 of retirement, that same purchasing power demands $134,000.
This means retirement portfolios must generate returns that exceed inflation, or principal will be depleted faster than anticipated. The math behind money requires growth-oriented assets even in retirement to combat this erosion.
Longevity Risk: You Might Live Longer Than Expected
Life expectancy continues to increase. A 65-year-old in 2025 has an average remaining life expectancy of 18.6 years for men and 21.0 years for women[5]. However, these are averages—25% of 65-year-olds will live past age 90.
Planning for a 30-year retirement (age 65-95) instead of 20 years requires 50% more accumulated savings, assuming the same withdrawal rate. Underestimating longevity represents one of the most common retirement planning failures.
The Social Security Administration provides detailed actuarial tables showing survival probabilities at various ages. Using these data points, conservative retirement planning should assume at least a 25-30 year time horizon for anyone retiring in their mid-60s.
The Real Cost of Starting Late
Beyond requiring higher contributions, late starters face additional challenges:
- Reduced risk capacity: Less time to recover from market downturns
- Lower contribution limits: Can’t “catch up” beyond IRS-defined limits ($7,500 additional for those 50+ in 2025)
- Compressed timeline: Must balance retirement savings with other peak expenses (college tuition, mortgage payoff)
- Behavioral pressure: Larger required contributions create the temptation to take excessive investment risk
Data point: According to the Federal Reserve Survey of Consumer Finances, the median retirement account balance for families aged 55-64 is only $185,000[6]—far below what most financial planners recommend for a comfortable retirement.
Starting early eliminates these compounding challenges and creates financial flexibility that late starters never achieve.
How Much Do You Need to Retire?
The retirement savings target depends on expected annual expenses, income sources, and withdrawal strategy. While rules of thumb provide starting points, personalized calculations deliver accuracy.
The Income Replacement Rule
Most financial planners recommend replacing 70-80% of pre-retirement income to maintain living standards. This percentage accounts for reduced expenses in retirement:
- No retirement account contributions (you’re withdrawing, not contributing)
- No payroll taxes (Social Security, Medicare)
- Potentially lower income taxes (depending on withdrawal strategy)
- Reduced work-related expenses (commuting, professional wardrobe)
However, some expenses increase:
- Healthcare costs (even with Medicare)
- Travel and leisure activities
- Potential long-term care needs
Therefore, the replacement ratio should be personalized based on the planned retirement lifestyle. Someone planning extensive travel might need 90-100% replacement, while someone with a paid-off home and modest plans might need only 60-70%.
Rules of Thumb vs Personalized Planning
The 25x Rule: Multiply your desired annual retirement income by 25. This derives from the 4% withdrawal rate (1/25 = 0.04 or 4%).
Example: If you need $60,000 annually in retirement, you need $1.5 million saved ($60,000 × 25).
The 4% Rule: Withdraw 4% of your portfolio in year one of retirement, then adjust that dollar amount for inflation each subsequent year. Research suggests this provides a 90-95% probability of not outliving your money over 30 years[7].
However, these rules make assumptions:
- 50% stock / 50% bond allocation
- 30-year retirement horizon
- Historical return patterns continue
- No major healthcare catastrophes
Personalized planning accounts for:
- Your specific asset allocation and expected returns
- Pension or annuity income
- Social Security benefits (which you can estimate at ssa.gov)
- Geographic location (cost of living varies dramatically)
- Health status and family longevity patterns
- Planned retirement age and life expectancy
Lifestyle-Based Estimates
Modest retirement: $40,000-50,000/year → $1-1.25 million needed
Comfortable retirement: $60,000-80,000/year → $1.5-2 million needed
Affluent retirement: $100,000+/year → $2.5+ million needed
These estimates assume Social Security provides $20,000-25,000 annually, with portfolio assets funding the remainder.
The math: If Social Security provides $24,000 and you need $70,000 total, your portfolio must generate $46,000 annually. At a 4% withdrawal rate, this requires $1.15 million ($46,000 ÷ 0.04).
🔗 Calculate your specific number: How Much Do I Need to Retire provides detailed frameworks for personalized retirement target calculation.
Retirement Savings by Age
Age-based savings benchmarks provide checkpoints to assess whether you’re on track. These multiples represent total retirement savings as a ratio of current annual income.
Fidelity’s Age-Based Savings Guidelines
| Age | Savings Multiple | Example (at $75,000 salary) |
|---|---|---|
| 30 | 1× annual salary | $75,000 |
| 40 | 3× annual salary | $225,000 |
| 50 | 6× annual salary | $450,000 |
| 60 | 8× annual salary | $600,000 |
| 67 | 10× annual salary | $750,000 |
These benchmarks assume:
- Saving 15% of income annually (including employer match)
- Retiring at age 67
- Maintaining current lifestyle in retirement
- Receiving Social Security benefits
Important context: These are guidelines, not requirements. Individual circumstances vary significantly based on:
- Starting age: Late starters need higher multiples to compensate
- Retirement age: Early retirement (before 65) requires larger accumulations
- Other income sources, Pensions, rental income, or part-time work, reduce the needed savings
- Geographic location: Cost-of-living differences affect required amounts
- Health status: Chronic conditions increase healthcare cost projections
Why Benchmarks Vary Across Sources
Different financial institutions publish different benchmarks because they make different assumptions about:
- Contribution rates (10% vs. 15% vs. 20%)
- Expected investment returns (6% vs. 7% vs. 8%)
- Retirement age (62 vs. 65 vs. 67)
- Income replacement ratio (70% vs. 80% vs. 90%)
T. Rowe Price recommends 1× salary by 30, 5× by 50, and 11× by 65—slightly more aggressive than Fidelity’s benchmarks[8]. This reflects different modeling assumptions about market returns and contribution consistency.
Avoiding Discouragement: Progress Over Perfection
If you’re behind these benchmarks, the appropriate response is strategic adjustment, not paralysis:
Tactical responses:
- Increase contribution rate: Even a 1-2% increase compounds significantly over time
- Delay retirement: Each additional working year provides a triple benefit (more contributions, more growth time, fewer withdrawal years)
- Optimize investment allocation: Ensure appropriate risk exposure for your time horizon
- Reduce planned retirement expenses: Geographic arbitrage, housing downsizing, or lifestyle adjustments
The compounding effect of small changes: Increasing contributions from 10% to 12% of a $70,000 salary adds $1,400 annually. Over 20 years at 7% returns, this seemingly small change adds $60,900 to retirement savings.
Benchmark insight: These multiples serve as navigational tools, not judgments. Being below target at age 35 matters far less than establishing consistent contribution habits that persist for decades.
🔗 Detailed age-based analysis: Retirement Savings by Age breaks down specific strategies for each decade of your career.
Common Retirement Accounts Explained
Tax-advantaged retirement accounts accelerate wealth building by reducing tax drag on investment returns. Understanding the structural differences between account types optimizes contribution strategy.
401(k) Explained
A 401(k) is an employer-sponsored retirement plan that allows pre-tax contributions (traditional) or after-tax contributions (Roth), with investments growing tax-deferred or tax-free.
Key features:
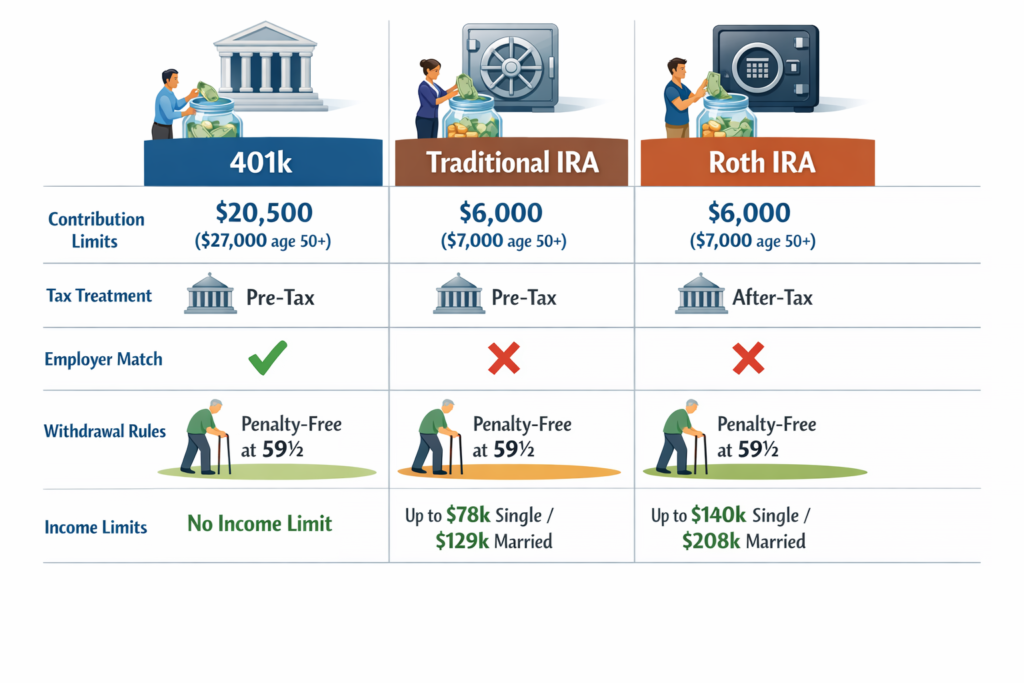
Contribution limits (2025): $23,500 for those under 50; $31,000 for those 50+ (includes $7,500 catch-up)[9]
Employer match: Many employers match contributions up to a certain percentage (commonly 3-6% of salary). This represents an immediate 100% return on investment—the single best risk-free return available.
Tax treatment (Traditional 401k):
- Contributions reduce current taxable income
- Growth is tax-deferred
- Withdrawals taxed as ordinary income in retirement
Tax treatment (Roth 401k):
- Contributions made with after-tax dollars (no current deduction)
- Growth is tax-free
- Qualified withdrawals are completely tax-free
Withdrawal rules:
- Penalty-free withdrawals begin at age 59½
- Required Minimum Distributions (RMDs) start at age 73 (for those born 1951-1959) or 75 (born 1960+)[10]
- Early withdrawals (before 59½) incur a 10% penalty plus ordinary income tax, with limited exceptions
The employer match advantage: If your employer matches 50% of contributions up to 6% of salary, and you earn $80,000, contributing $4,800 (6%) generates an additional $2,400 from the employer—a guaranteed 50% return before any investment growth.
Vesting schedules: Employer contributions may vest over time (typically 2-6 years). Changing jobs before full vesting means forfeiting unvested employer contributions.
🔗 Detailed mechanics: 401(k) Explained covers contribution strategies, investment selection, and optimization techniques.
IRA Explained
An Individual Retirement Account (IRA) provides tax-advantaged retirement savings independent of employer plans. Anyone with earned income can contribute to an IRA.
Contribution limits (2025): $7,000 for those under 50; $8,000 for those 50+[11]
Two primary types:
Traditional IRA:
- Contributions may be tax-deductible (depending on income and workplace plan coverage)
- Growth is tax-deferred
- Withdrawals taxed as ordinary income
- RMDs required starting at age 73-75
Roth IRA:
- Contributions made with after-tax dollars (never deductible)
- Growth is tax-free
- Qualified withdrawals are completely tax-free
- No RMDs during the owner’s lifetime
- Income limits restrict high earners from direct contributions
Income limits for Roth IRA (2025):
- Single filers: Phase-out begins at $150,000, complete at $165,000
- Married filing jointly: Phase-out begins at $236,000, complete at $246,000[12]
Strategic use: IRAs complement workplace plans. If you maximize 401(k) contributions and still have savings capacity, IRAs provide additional tax-advantaged space. They also offer broader investment options than most 401(k) plans.
🔗 Complete IRA framework: IRA Explained details contribution strategies, deduction rules, and conversion tactics.
Roth IRA vs Traditional IRA
The choice between Roth and Traditional depends on current vs. future tax rates—a comparison of tax timing.
Choose a Traditional IRA when:
- Current tax bracket is high (24%+ federal)
- Expect a lower tax bracket in retirement
- Need current tax deduction to maximize contribution capacity
- Approaching retirement with limited time for tax-free growth
Choose a Roth IRA when:
- Current tax bracket is low (12% or 22% federal)
- Expect the same or a higher tax bracket in retirement
- Want tax-free income flexibility in retirement
- Decades until retirement (maximizes tax-free compounding)
- Want to avoid RMDs
The mathematical comparison:
Traditional IRA scenario:
- Contribute $7,000 (pre-tax)
- Tax savings at 24% bracket: $1,680
- Growth over 30 years at 7%: $53,283
- Withdrawal at 22% tax rate: $41,561 after-tax
Roth IRA scenario:
- Contribute $7,000 (after-tax, costs $9,211 in pre-tax income at 24% bracket)
- No tax savings today
- Growth over 30 years at 7%: $53,283
- Withdrawal: $53,283 (completely tax-free)
Result: Roth wins if the retirement tax rate equals or exceeds the contribution tax rate. Traditional wins if the retirement tax rate is meaningfully lower.
Additional Roth advantages:
- No RMDs allow continued tax-free growth
- Tax-free withdrawals don’t increase taxable income (avoiding Medicare premium surcharges)
- Superior estate planning vehicle (heirs receive tax-free inheritance)
Tax diversification strategy: Many planners recommend holding both Traditional and Roth accounts to create withdrawal flexibility in retirement, allowing tax-efficient income management.
🔗 Detailed comparison framework: Roth IRA vs Traditional IRA provides decision matrices and tax projection tools.
How to Invest for Retirement
Retirement investing requires balancing growth potential with risk management across a multi-decade time horizon. The framework prioritizes asset allocation, diversification, and time-horizon alignment.
Asset Allocation Basics
Asset allocation—the division of your portfolio among stocks, bonds, and other assets—determines approximately 90% of portfolio return variance[13]. Security selection and market timing contribute far less to long-term outcomes.
The fundamental trade-off:
- Stocks: Higher expected returns (10% historical average), higher volatility
- Bonds: Lower expected returns (5-6% historical average), lower volatility, income generation
- Cash: Lowest returns (matches inflation at best), highest stability
Age-based allocation rule of thumb: 110 minus your age = stock percentage
Examples:
- Age 30: 80% stocks, 20% bonds (110 – 30 = 80)
- Age 50: 60% stocks, 40% bonds (110 – 50 = 60)
- Age 70: 40% stocks, 60% bonds (110 – 70 = 40)
This formula adjusts risk exposure as retirement approaches, reducing volatility when recovery time diminishes.
However, modern longevity requires modification. With 30-year retirement horizons, maintaining some equity exposure throughout retirement combats inflation and prevents portfolio depletion.
Improved framework:
- Accumulation phase (20-30 years to retirement): 80-90% stocks
- Transition phase (10-20 years to retirement): 60-70% stocks
- Early retirement (first 10-15 years): 50-60% stocks
- Late retirement (15+ years into retirement): 30-40% stocks
Risk Tolerance vs. Time Horizon
Risk tolerance is your psychological ability to withstand portfolio volatility without panic selling. Risk capacity is your financial ability to absorb losses based on time horizon and income needs.
Critical distinction: High risk tolerance with low risk capacity (retiring in 3 years) should not result in aggressive allocation. Risk capacity sets the ceiling; risk tolerance operates within that constraint.
Time horizon considerations:
30+ years to retirement:
- Maximum growth priority
- Can absorb multiple market cycles
- Short-term volatility irrelevant
- 85-90% stock allocation is appropriate
10-20 years to retirement:
- Balance growth with preservation
- One major bear market is tolerable
- Begin gradual de-risking
- 60-70% stock allocation
5-10 years to retirement:
- Preservation becomes a priority
- Limited recovery time from major losses
- Accelerate de-risking
- 40-50% stock allocation
In retirement:
- Maintain growth to combat inflation
- Reduce sequence-of-returns risk
- Never go to 100% bonds/cash
- 30-50% stock allocation depending on portfolio size and income needs
Diversification: Not Holding Everything, But Holding Enough
Diversification reduces unsystematic risk (company-specific risk) without sacrificing expected returns. The math behind money shows that 20-30 stocks across different sectors capture most diversification benefits.
Effective diversification includes:
Geographic diversification: U.S. and international stocks (developed and emerging markets)
Sector diversification: Technology, healthcare, financials, consumer goods, energy, etc.
Asset class diversification: Stocks, bonds, real estate (REITs), commodities
For most retirement investors, index funds provide optimal diversification:
- Total stock market index: Instant exposure to 3,000+ U.S. companies
- International index: Exposure to developed and emerging markets
- Bond index: Diversified fixed-income exposure across maturities and credit qualities
Example simple three-fund portfolio:
- 60% U.S. Total Stock Market Index
- 20% International Stock Index
- 20% U.S. Bond Index
This provides exposure to ~10,000 stocks and thousands of bonds with just three holdings—maximum diversification with minimal complexity.
Over-diversification warning: Holding 15+ individual funds or 50+ individual stocks creates overlap without additional benefit and makes rebalancing unnecessarily complex.
Rebalancing Maintains Target Allocation
Market movements cause portfolio drift from the target allocation. A 60/40 stock/bond portfolio might become 70/30 after a strong stock market year, increasing risk beyond intended levels.
Rebalancing strategies:
Calendar rebalancing: Review and rebalance annually or semi-annually
Threshold rebalancing: Rebalance when any asset class drifts 5+ percentage points from target
Rebalancing forces disciplined behavior: Selling appreciated assets (stocks after gains) and buying undervalued assets (bonds after stock rallies) implements “buy low, sell high” systematically.
Tax considerations: Execute rebalancing in tax-advantaged retirement accounts to avoid capital gains taxes. In taxable accounts, use new contributions to rebalance rather than selling appreciated positions.
Evidence-based insight: Studies show rebalancing frequency (annual vs. quarterly vs. monthly) matters less than consistency. Annual rebalancing provides 90%+ of the benefit with minimal effort.
Retirement Withdrawal Strategies
Accumulation receives extensive attention, but the withdrawal strategy determines whether savings last 20 years or 40 years. The sequence and source of withdrawals significantly impact portfolio longevity and tax efficiency.
Sequence of Returns Risk
Sequence of returns risk describes the danger of experiencing poor investment returns early in retirement when withdrawals begin. The order of returns matters more than average returns when you’re withdrawing funds.
Example demonstrating sequence risk:
Portfolio A: Returns of -10%, -5%, +8%, +12%, +10% (average: 3%)
Portfolio B: Returns of +10%, +12%, +8%, -5%, -10% (average: 3%)
Both portfolios average 3% annually, but with $1 million starting balance and $50,000 annual withdrawals:
Portfolio A (poor early returns): Depletes to $850,000 after 5 years
Portfolio B (strong early returns): Grows to $1,050,000 after 5 years
The difference: Portfolio A suffered losses while withdrawals occurred, selling shares at depressed prices. Portfolio B enjoyed gains while withdrawing, preserving principal.
Mitigation strategies:
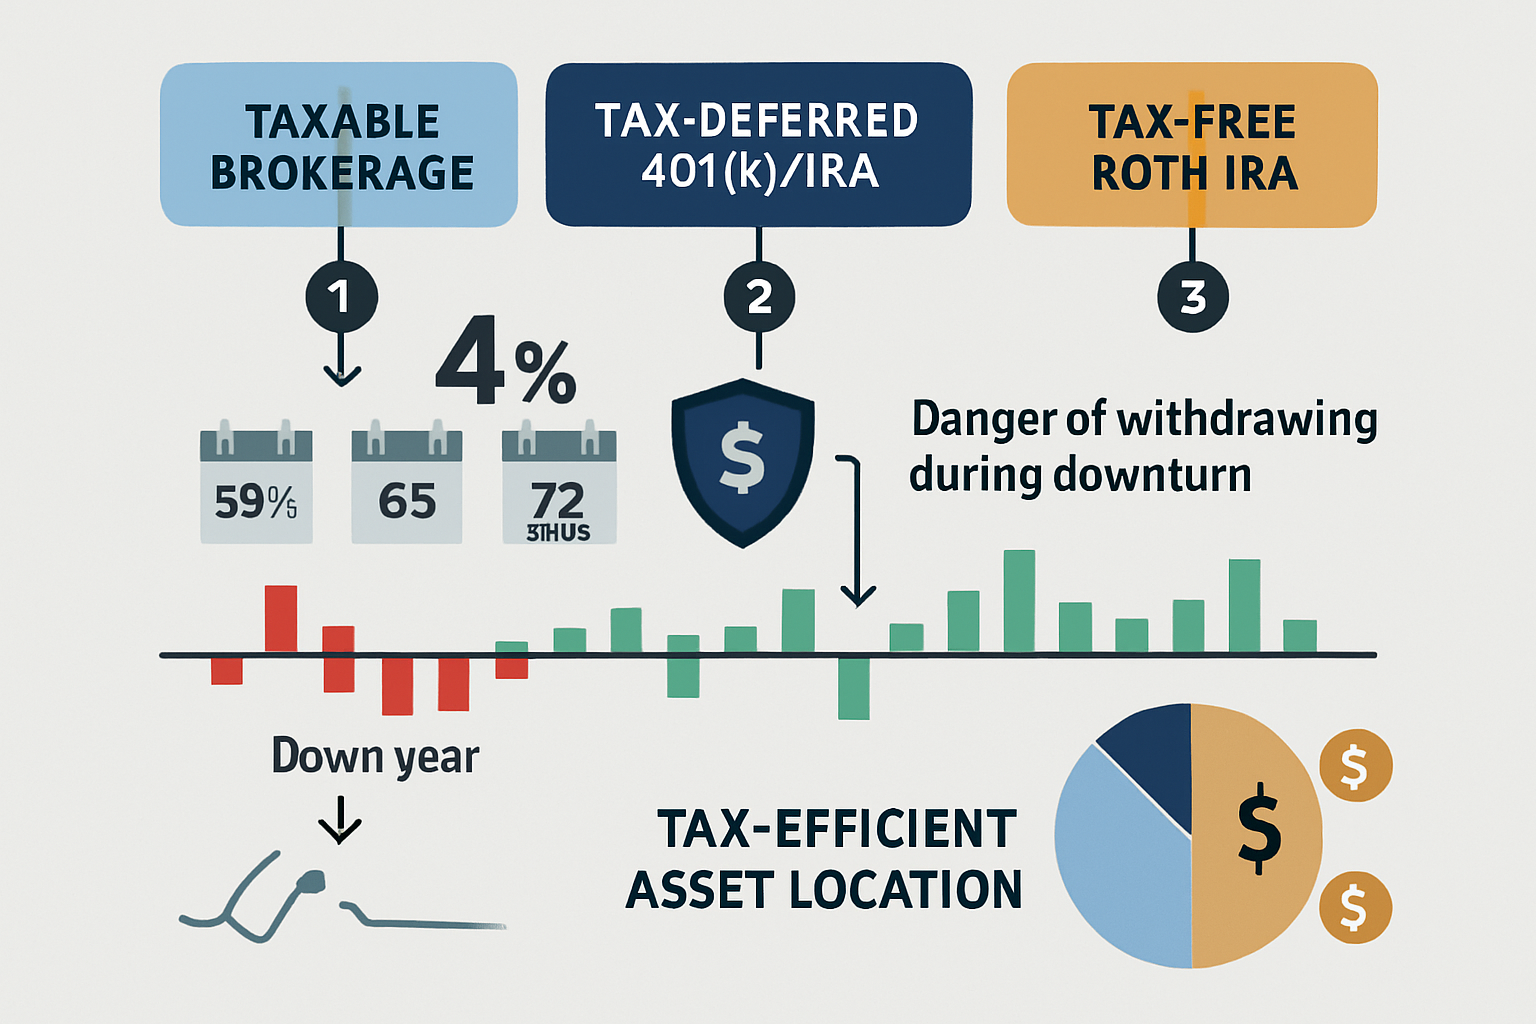
- Maintain cash reserve: Hold 1-2 years of expenses in cash/bonds to avoid selling stocks during downturns
- Flexible withdrawal rate: Reduce spending 10-20% during bear markets to preserve principal
- Bucket strategy: Divide portfolio into short-term (cash), medium-term (bonds), and long-term (stocks) buckets
- Part-time income: Even a modest income during early retirement dramatically reduces sequence risk
Withdrawal Order: Tax-Efficient Sequencing
The account from which you withdraw funds affects tax liability and portfolio longevity. Strategic sequencing can extend portfolio life by 5-10 years.
Standard withdrawal order:
Step 1: Taxable accounts first
- No RMD requirements
- Can harvest losses to offset gains
- Qualified dividends and long-term capital gains are taxed at preferential rates (0%, 15%, or 20%)
- Allows tax-deferred and tax-free accounts to continue growing
Step 2: Tax-deferred accounts (Traditional 401k/IRA)
- After taxable accounts are depleted
- Manage withdrawals to stay in lower tax brackets
- Must begin by age 73-75 due to RMDs
- Converts tax-deferred growth to taxable income
Step 3: Tax-free accounts (Roth IRA/401k)
- Withdraw last to maximize tax-free compounding
- No RMDs during the owner’s lifetime
- Provides tax-free income in late retirement when RMDs from traditional accounts might push you into higher brackets
- Superior estate planning vehicle
Exception scenarios:
Low-income years: If retiring before Social Security begins (age 62-70), you may have years in the 10-12% tax bracket. Consider Roth conversions during these years, converting Traditional IRA funds to Roth at low tax rates.
High-balance Traditional IRAs: If Traditional IRA balances are large, RMDs at age 73+ might push you into high tax brackets. Strategic withdrawals before RMDs begin can reduce future tax burden.
Charitable giving: Qualified Charitable Distributions (QCDs) from IRAs after age 70½ satisfy RMDs without increasing taxable income—superior to withdrawing, paying tax, then donating.
Tax Efficiency Basics
Minimize taxes through strategic account location:
Tax-inefficient investments → Tax-deferred accounts:
- Bonds (generate ordinary income)
- REITs (dividends taxed as ordinary income)
- Actively managed funds (generate capital gains distributions)
Tax-efficient investments → Taxable accounts:
- Index funds (minimal distributions)
- Individual stocks held long-term (control timing of capital gains)
- Municipal bonds (tax-free interest)
Growth investments → Roth accounts:
- Stocks with the highest expected returns
- Maximizes tax-free compounding on assets most likely to appreciate
This strategy reduces annual tax drag, allowing more money to compound over decades.
🔗 Comprehensive withdrawal planning: Retirement Withdrawal Strategies provides detailed frameworks for tax-efficient income generation.
Common Retirement Planning Mistakes to Avoid
Understanding common errors helps you avoid costly mistakes that compound over decades. Each mistake represents lost wealth that simple awareness prevents.
Mistake #1: Starting Too Late
The error: Believing retirement planning can wait until your 40s or 50s.
The cost: As demonstrated earlier, delaying from age 25 to 35 requires 2.15× higher monthly contributions. Delaying to age 45 requires 5× higher contributions.
The solution: Begin contributing to retirement accounts with your first paycheck, even if amounts are small. A 22-year-old contributing $200/month builds better habits and outcomes than a 35-year-old contributing $500/month.
Behavioral insight: Establishing automatic contributions at 5-10% of income when you’re young means you never adjust lifestyle to that income—you can’t miss what you never had.
Mistake #2: Ignoring Fees
The error: Overlooking investment fees and expense ratios that seem small in isolation.
The cost: A 1% annual fee on a $500,000 portfolio costs $5,000 per year. Over 30 years, these compounds have grown to approximately $280,000 in lost wealth (assuming 7% returns).
Fee comparison:
- Actively managed mutual fund: 0.80-1.50% expense ratio
- Index fund: 0.03-0.20% expense ratio
- Target-date fund: 0.10-0.75% expense ratio
The solution: Prioritize low-cost index funds and ETFs. A 0.05% expense ratio versus a 1.00% expense ratio saves $237,000 over 30 years on a $500,000 portfolio.
401(k) fee awareness: Review plan fee disclosures. Some 401(k) plans charge administrative fees (0.25-1.00%) on top of fund expense ratios. If your employer plan has high fees and no match, consider contributing only enough to capture the match, then directing additional savings to a low-cost IRA.
Mistake #3: Underestimating Healthcare Costs
The error: Assuming Medicare covers all retirement healthcare expenses.
The cost: Fidelity estimates a 65-year-old couple retiring in 2025 will need approximately $315,000 to cover healthcare expenses throughout retirement[15]. This excludes long-term care.
Medicare gaps:
- Part B (medical insurance) costs $174.70/month in 2025 for most beneficiaries[16]
- Part D (prescription drug coverage) varies by plan
- Medigap or Medicare Advantage plans add additional premiums
- Deductibles, copays, and coinsurance
- Dental, vision, and hearing are not covered
Long-term care risk: The average cost of a private nursing home room exceeds $108,000 annually[17]. Even one year of care devastates retirement portfolios.
The solution:
- Include healthcare as a distinct line item in retirement budget (10-15% of expenses)
- Consider Health Savings Account (HSA) contributions while working—triple tax advantage for healthcare expenses
- Evaluate long-term care insurance in your 50s when premiums are manageable
- Plan for healthcare inflation at 5-6% annually (higher than general inflation)
Mistake #4: Panic Selling During Market Downturns
The error: Selling stocks during bear markets to “prevent further losses.”
The cost: Missing the recovery. The best market days typically occur immediately after the worst days. Missing just the 10 best days over 20 years reduces returns by approximately 50%[18].
Historical context: Every bear market in history has been followed by recovery and new highs. The S&P 500 has never failed to recover from a downturn given sufficient time.
The solution:
- Maintain appropriate asset allocation for your time horizon
- Rebalance into stocks during downturns (buying low)
- Remember that volatility is the price of admission for higher returns
- Review historical bear market data to calibrate expectations
Behavioral finance insight: Loss aversion causes investors to feel losses 2× more intensely than equivalent gains. This psychological bias drives panic selling at market bottoms—the worst possible time.
Mistake #5: No Plan for Retirement Income
The error: Focusing exclusively on accumulation without planning how to convert assets into sustainable income.
The cost: Inefficient withdrawals, excessive taxes, or premature portfolio depletion.
The solution: Develop a comprehensive income plan addressing:
- Social Security claiming strategy (age 62, 67, or 70)
- Withdrawal rate and sequence
- Tax-efficient distribution strategy
- Required Minimum Distribution planning
- Healthcare coverage bridge (if retiring before 65)
Social Security timing example: Claiming at age 62 versus age 70 changes monthly benefits by approximately 77%. For someone with a $2,000 monthly benefit at full retirement age (67):
- Claiming at 62: $1,400/month ($16,800/year)
- Claiming at 67: $2,000/month ($24,000/year)
- Claiming at 70: $2,480/month ($29,760/year)
For healthy individuals with longevity in their family, delaying Social Security often provides higher lifetime benefits and superior inflation protection (COLA adjustments apply to a higher base amount).
Retirement Calculators and Tools That Help
Data-driven retirement planning requires quantitative analysis. Calculators transform abstract goals into concrete contribution targets and probability-based projections.
Essential Retirement Planning Calculators
1. Comprehensive Retirement Calculator
Projects whether the current savings trajectory will meet retirement goals based on:
- Current age and planned retirement age
- Current retirement savings
- Monthly contribution amount
- Expected investment returns
- Desired retirement income
🔗 Calculate your retirement readiness: Retirement Calculator provides a Monte Carlo simulation showing the probability of success under various market scenarios.
2. 401(k) Calculator
Specifically models 401(k) growth including:
- Employer match calculations
- Contribution limit tracking
- Tax savings from pre-tax contributions
- Roth vs. Traditional comparison
🔗 Optimize 401(k) contributions: 401(k) Calculator shows the impact of increasing contribution rates by 1-2%.
3. Roth IRA Calculator
Compares Roth IRA versus Traditional IRA outcomes based on:
- Current and projected retirement tax brackets
- Years until retirement
- Contribution amounts
- Expected returns
🔗 Determine optimal account type: Roth IRA Calculator quantifies the tax-free growth advantage over decades.
Using Calculators Effectively
Garbage in, garbage out: Calculator accuracy depends on input quality. Use realistic assumptions:
Investment returns: 6-7% for balanced portfolios (historical inflation-adjusted returns)
Inflation: 2.5-3.0% annually
Retirement duration: 30 years minimum
Income replacement: 70-80% of pre-retirement income
Sensitivity analysis: Run calculations with different assumptions:
- Conservative scenario: 5% returns, 3.5% inflation, 35-year retirement
- Moderate scenario: 7% returns, 3.0% inflation, 30-year retirement
- Optimistic scenario: 8% returns, 2.5% inflation, 25-year retirement
Planning for the conservative scenario ensures you’re prepared if optimistic assumptions don’t materialize.
Beyond Basic Calculators: Advanced Planning Tools
Social Security benefits estimator: Visit ssa.gov to create an account and view your projected benefits based on actual earnings history. This provides personalized estimates rather than generic assumptions.
Tax planning software: Tools like TurboTax or H&R Block allow you to model the tax impact of different withdrawal strategies, Roth conversions, and contribution levels.
Portfolio analysis tools: Morningstar’s Portfolio Manager and Personal Capital analyze your actual holdings, showing asset allocation, fees, and tax efficiency.
Monte Carlo simulators: Tools like FIRECalc or cFIREsim run thousands of historical market scenarios to show the probability of portfolio success—more sophisticated than simple average return assumptions.
How Retirement Planning Fits Into Your Bigger Financial Plan
Retirement planning doesn’t exist in isolation—it integrates with comprehensive financial management, including budgeting, debt management, emergency savings, and estate planning.
The Financial Planning Hierarchy
Foundation level: Cash flow management
- Income exceeds expenses
- Budget tracking and optimization
- Behavioral spending control
Security level: Emergency fund and insurance
- 3-6 months’ expenses in liquid savings
- Adequate insurance (health, life, disability, property)
- Risk protection before wealth building
Growth level: Debt elimination and investing
- High-interest debt payoff (credit cards, personal loans)
- Retirement account contributions
- Taxable investment accounts
Optimization level: Tax efficiency and estate planning
- Tax-loss harvesting
- Roth conversions
- Estate documents (will, trust, power of attorney)
Retirement represents the outcome of successfully executing each level. You can’t retire confidently without first mastering cash flow, protecting against risks, eliminating destructive debt, and building assets systematically.
Budgeting → Investing → Retirement Income
The wealth-building sequence:
Step 1: The Budget creates a surplus
Income – Expenses = Savings capacity
Without a consistent surplus, retirement contributions remain impossible. The math behind money requires that you spend less than you earn—this non-negotiable principle enables everything else.
Step 2: Surplus funds retirement contributions
Automatic contributions to 401(k), IRA, or other retirement accounts transform monthly surplus into invested assets.
Step 3: Invested assets compound over decades
Time × Contribution Rate × Investment Returns = Retirement portfolio
Step 4: Portfolio generates retirement income
Portfolio × Withdrawal Rate = Annual retirement income
Each step depends on the previous step. Skipping budget discipline means no surplus. No surplus means no contributions. No contributions means no portfolio. No portfolio means no retirement income.
Retirement as Outcome, Not Account Type
Mental model shift: Retirement isn’t a specific account—it’s a financial state where investment income and benefits exceed expenses, making employment optional.
This reframing clarifies that:
- Taxable brokerage accounts contribute to retirement just like IRAs
- Real estate rental income funds for retirement
- Part-time consulting or business income supplements portfolio withdrawals
- Social Security and pensions are income sources, not complete solutions
The retirement income equation:
Total Retirement Income = Portfolio Withdrawals + Social Security + Pension + Rental Income + Part-time Work + Other Sources
Total Retirement Expenses = Housing + Healthcare + Food + Transportation + Discretionary + Taxes + Insurance
Retirement readiness occurs when Total Income ≥ Total Expenses with high confidence over 30+ years.
This comprehensive view prevents the common mistake of focusing exclusively on 401(k) balances while ignoring other assets and income sources.
🔗 Build the foundation: Personal Finance Basics establishes the cash flow management and budgeting discipline that makes retirement planning possible.
💰 Retirement Savings Calculator
Calculate how much you’ll have at retirement based on your current savings and contributions
Conclusion
Retirement planning transforms abstract future goals into concrete mathematical targets achieved through systematic saving, strategic investing, and tax-efficient withdrawal planning.
The fundamental principles:
Start immediately – Every year of delay exponentially increases required contribution rates due to lost compound growth
Maximize tax-advantaged accounts – 401(k)s and IRAs provide immediate tax benefits or tax-free growth that accelerates wealth accumulation by 20-40% compared to taxable accounts
Capture free money – Employer 401(k) matches represent guaranteed 50-100% returns that no other investment provides
Maintain appropriate risk exposure – Stock allocation should align with time horizon, gradually decreasing as retirement approaches, but never eliminating growth assets entirely
Plan for longevity – 30-year retirement horizons require larger portfolios and continued equity exposure to combat inflation
Optimize withdrawal strategy – Tax-efficient sequencing and sequence-of-returns risk management extend portfolio longevity by 5-10 years
Your next steps:
- Calculate your retirement number using the 25× rule or a detailed retirement calculator
- Determine the current savings rate and compare it to age-based benchmarks
- Maximize employer 401(k) match if available—never leave free money on the table
- Open an IRA if you’ve maxed out employer plans or want additional tax-advantaged space
- Automate contributions to remove behavioral barriers and ensure consistency
- Review and rebalance annually to maintain target asset allocation
- Develop a withdrawal strategy at least 5 years before planned retirement
The math behind money reveals a liberating truth: Retirement security doesn’t require exceptional income or investment genius. It requires starting early, contributing consistently, minimizing fees, maintaining discipline during market volatility, and allowing compound growth to work over decades.
A 25-year-old earning $50,000 who saves 15% annually in low-cost index funds will accumulate approximately $1.8 million by age 65 at 7% returns—enough to generate $72,000 annually at a 4% withdrawal rate, replacing 144% of their starting salary (adjusted for wage growth over their career).
This outcome requires no special knowledge, no market timing, no stock picking—just consistent execution of evidence-based principles.
Retirement planning works because mathematics works. The compound interest formula doesn’t care about market sentiment, economic predictions, or financial media noise. It responds only to three variables you control: contribution amount, time horizon, and investment returns (through asset allocation and fee minimization).
Start today. The best time to begin retirement planning was 20 years ago. The second-best time is now.
Related Guides
Saving for Retirement Early – Detailed strategies for maximizing compound growth in your 20s and 30s
Understanding Retirement Accounts – Comprehensive comparison of all retirement account types and tax treatments
Planning Retirement Income – Advanced withdrawal strategies and Social Security optimization
Avoiding Retirement Mistakes – Common errors that cost retirees hundreds of thousands and how to prevent them
References
[1] Social Security Administration. (2025). “Replacement Rates for Hypothetical Workers.” SSA.gov.
[2] Social Security Administration. (2025). “Monthly Statistical Snapshot, January 2025.” SSA.gov.
[3] Social Security Administration. (2025). “Benefit Amounts for Workers Retiring in 2025.” SSA.gov.
[4] Bureau of Labor Statistics. (2025). “Consumer Price Index Historical Data, 1990-2025.” BLS.gov.
[5] Social Security Administration. (2024). “Actuarial Life Table.” SSA.gov.
[6] Federal Reserve. (2023). “Survey of Consumer Finances.” FederalReserve.gov.
[7] Bengen, William P. (1994). “Determining Withdrawal Rates Using Historical Data.” Journal of Financial Planning.
[8] T. Rowe Price. (2025). “How Much Should You Have Saved for Retirement?” TRowePrice.com.
[9] Internal Revenue Service. (2025). “401(k) Contribution Limits.” IRS.gov.
[10] Internal Revenue Service. (2025). “Retirement Plan and IRA Required Minimum Distributions FAQs.” IRS.gov.
[11] Internal Revenue Service. (2025). “IRA Contribution Limits.” IRS.gov.
[12] Internal Revenue Service. (2025). “Roth IRA Income Limits.” IRS.gov.
[13] Brinson, Gary P., Hood, L. Randolph, and Beebower, Gilbert L. (1986). “Determinants of Portfolio Performance.” Financial Analysts Journal.
[14] Vanguard Research. (2023). “Best Practices for Portfolio Rebalancing.” Vanguard.com.
[15] Fidelity Investments. (2025). “How to Plan for Rising Health Care Costs.” Fidelity.com.
[16] Centers for Medicare & Medicaid Services. (2025). “Medicare Costs at a Glance.” Medicare.gov.
[17] Genworth Financial. (2024). “Cost of Care Survey.” Genworth.com.
[18] J.P. Morgan Asset Management. (2024). “Guide to Retirement: The Cost of Missing the Best Days.” JPMorgan.com.
Disclaimer
This content is for educational purposes only and does not constitute financial, investment, or retirement advice. Retirement planning involves complex personal circumstances, tax considerations, and market risks that require individualized analysis.
Consult with qualified financial advisors, tax professionals, and retirement specialists before making significant financial decisions. Past performance does not guarantee future results. Investment returns are not guaranteed, and portfolios can lose value.
The calculators and projections provided use simplified assumptions and may not reflect your actual outcomes. Actual results depend on market performance, contribution consistency, fee structures, tax situations, and numerous other variables.
About the Author
Max Fonji is the founder of The Rich Guy Math, a financial education platform dedicated to explaining the mathematical principles behind wealth building, investing, and retirement planning.
With a background in financial analysis and data-driven decision-making, Max translates complex financial concepts into clear, actionable frameworks that empower readers to make informed decisions about their money.
The Rich Guy Math focuses on evidence-based strategies, quantitative analysis, and the cause-and-effect relationships that determine financial outcomes. Every article prioritizes clarity, precision, and educational value over marketing hype.
Max’s approach combines analytical rigor with accessible teaching, helping beginners and intermediate investors understand how money actually works—through numbers, logic, and proven principles.
Frequently Asked Questions
Can I retire without a 401(k)?
Yes. A 401(k) is one retirement savings vehicle, not a requirement. You can build retirement savings through multiple alternatives:
- Traditional and Roth IRAs (with annual contribution limits)
- Taxable brokerage accounts with no contribution limits
- Real estate investments that generate rental income
- Small business or self-employment plans such as SEP-IRAs or Solo 401(k)s
The core principle remains the same regardless of account type: save consistently, invest for growth, and accumulate assets that can generate sustainable retirement income. A 401(k) accelerates this process through tax advantages and employer matching, but its absence does not prevent retirement—it simply requires higher personal savings rates.
How much should I save if I start late?
Starting late requires higher contribution rates, but retirement is still achievable with disciplined saving and realistic planning.
Starting at age 40 (25 years to retirement):
- Save 20–25% of gross income
- Maximize catch-up contributions after age 50
- Consider working 2–3 additional years
- Target 8–10× final salary by retirement
Starting at age 50 (15 years to retirement):
- Save 30–40% of gross income
- Maximize all catch-up contributions
- Plan to delay Social Security to age 70
- Consider relocating to a lower cost-of-living area
- Target 6–8× final salary by retirement
Example: Someone earning $80,000 at age 40 who saves $20,000 annually for 25 years at a 7% return accumulates approximately $1.27 million—supporting roughly $50,000 per year using a 4% withdrawal rate.
Is Roth or Traditional better for me?
The optimal choice depends on your current tax rate versus your expected tax rate in retirement.
Choose a Roth account if:
- Your current marginal tax rate is low (12%–22%)
- You are early in your career
- You expect higher income and tax rates later
- You want tax-free withdrawals and no required minimum distributions
Choose a Traditional account if:
- Your current marginal tax rate is high (24%+)
- You are in peak earning years
- You expect lower income in retirement
- You need the tax deduction to increase savings capacity
Many investors use tax diversification—holding both Roth and Traditional accounts—to create flexibility in retirement withdrawals and tax planning.
What happens if I outlive my savings?
Outliving savings is a major retirement risk, but it can be mitigated with proactive planning.
Prevention strategies include:
- Using conservative withdrawal rates (3.5% instead of 4%)
- Maintaining equity exposure to offset inflation
- Delaying Social Security to age 70
- Planning for a 35-year retirement horizon
Adjustment strategies if depletion appears likely:
- Reducing discretionary spending
- Downsizing or relocating
- Generating part-time income
- Optimizing spousal Social Security strategies
- Using a reverse mortgage as a last resort
Even in worst-case scenarios, Social Security provides baseline income, preventing absolute financial collapse—though lifestyle adjustments may be necessary.
Should I pay off debt before investing for retirement?
The answer depends on interest rates, debt type, and opportunity cost.
Pay off first:
- Credit card debt
- High-interest personal loans
- Any debt with interest exceeding expected investment returns
Invest while paying minimums:
- Low-interest mortgages
- Federal student loans
- Auto loans with modest rates
High-interest debt repayment offers a guaranteed return equal to the interest rate. Low-interest debt often costs less than long-term investment returns, making concurrent investing mathematically favorable.
A balanced strategy for many households is to capture full employer matching first, eliminate high-interest debt next, and then increase retirement contributions.